By Mark Pruner
The hot neighborhoods are getting hotter in the first quarter of 2026. Of course, you could also say that they are coming back or that they are actually cooling off. It all depends on which metric you want to use. If you look at sales prices last year and compare them to sales prices this year, then the hot neighborhoods are Old Greenwich and Riverside and to a lesser degree Cos Cob and South of the Parkway (aka mid-country).
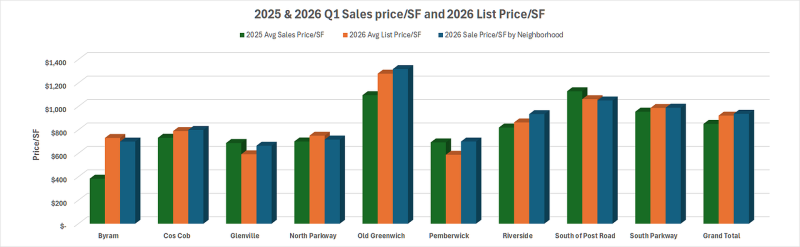
If you look at the price/sf, one of the better statistics to use to discover hotness, different neighborhoods can tell a different story. Last year OG properties sold for an average of $1,027/sf. So far this year, the list price is at $1,160/sf and the 2026 sales in OG are going for an average of $1,318/sf. Do a quick division and you can see that the average house in Old Greenwich has a sales price to original list price 105%. Last year the SP/OLP was only 96.8%.
Of course, last year in OG, we had 5 sales in Q1 and in the first three months of 2026, we had 12 sales or an increase of 140% in sales. A little more inventory in 2026, led to a lot more sales. Last year we had 10 houses for sale in OG and this year it’s up to 12 houses, plus a bunch that came on this year and went to contract in ths same month. These “blue moon” sales were never counted in the end of month inventory numbers.
This year, houses in Old Greenwich have been on for an average of 57 days down from 117 DOM last year. Our days on market were almost cut in half. Even that doesn’t really show just how hot the Old Greenwich market is. Of our 12 sales, two had been on for 6 months. The median days on market was actually 21 days. That’s three weeks to list the house, get agents to see it, then have the agents call their buyers, have them show up, have a few days for the listing agent to get in multiple offers and for the seller to decide on the best offer (its not always the highest offer). From there, you have inspections, contract drafting, some attorney discussions and only then does the contract get signed and days on market stop increasing. It’s a busy 3 weeks and two houses did all that in 9 days on market.
All this activity has driven up prices in Old Greenwich. Last year the average sales price was $3.8 million. List prices this year are up to an average of $3.83 million. Remember that SP/OLP ratio of 105%, that means the average Old Greenwich sales price in Old Greenwich so far this year is up to $6.49 million from $3.8 million last year. This an increase of 71% year-over-year, but that’s really meaningless. Remember that house that was on for over 6 months. It sold for $27.8 million. Take out that one sale and the average OG sales price in 2026 drops to $4.35 million or a more than $2 million lower average sales price.
While OG is arguably our hottest area, it’s not that different from Glenville, Pemberwick and Riverside, all three neighborhoods are seeing sales prices to original list prices of over 100%. They also have days on market of under 50 days. If you are looking to buy in these areas, you need to be prepared to move quickly. This is also true of the Byram and Cos Cob neighborhoods.
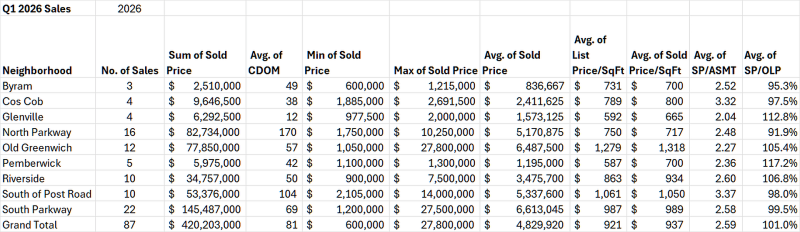
Actually, it’s true of all the neighbor hoods in Greenwich. If you are waiting for prices to come down significantly in any Greenwich neighborhood, you are going to be waiting a good long time. We did see some major price drops in several Greenwich neighborhoods. Average sales price was down 31% south of the Post Road and were down 56% in Byram. But wait, didn’t I just say that Byram was a hot neighborhood, how could the average sales price drop by more than half.
Once again, it’s the law of small numbers where if you have a small sample size and a long tail that varies greatly in length from one year to another, you see these anomalous price changes. Anomalous because the other stats don’t show a big drop in value. In Byram, the average sold price per square foot is up 83% (also anomalous), and the other statistics; sales price to assessment ratio, days on market and the sales price to original list price ratio all show a hot market. When you are looking at 1st quarter numbers, you want to look at more than one statistic to decide if an area is doing well.
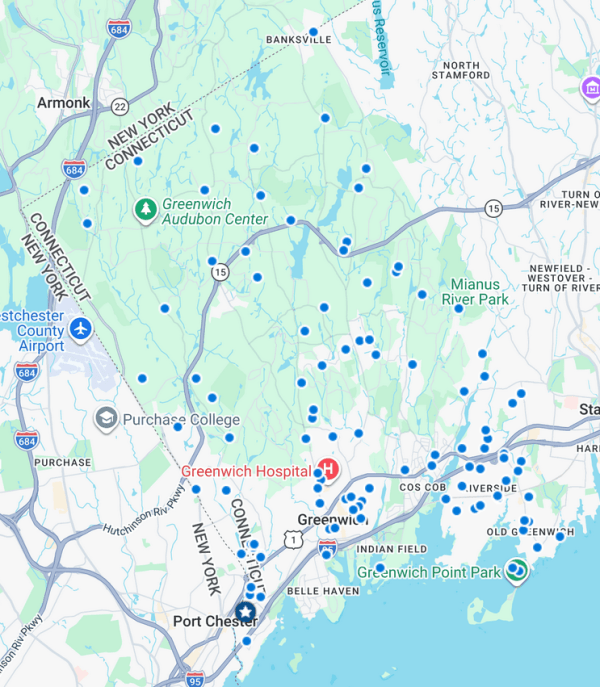
Another good indicator is the density of sales. Lots of sales in one area are also an indicator of a hot neighborhood. In Greenwich, you have to adjust for the size of the zone. Byram looks like it has a lot higher sales density than backcountry, but backcountry is a 4-acre zone and much of Byram is an R-6 zone. Now, the R-6 zone is the same minimum lot size as the R-7 zone, 7,500 s.f. or 0.172 acres. The difference is that the R-6 is a two-family zone, so you can have two sales on the same approximately 1/6th acre lot. Take the 16 sales in backcountry and multiple those sales by 23 times and you can see backcountry is pretty hot.
Stay tuned, our inventory for next months sales as our inventory finally took off this week with the good weather.
Mark Pruner is a sales executive with Compass Connecticut and a founder of the GreenwichStreets Team. He can be reached at 203-817-2871 or mark.pruner@compass.com