By Mark Pruner
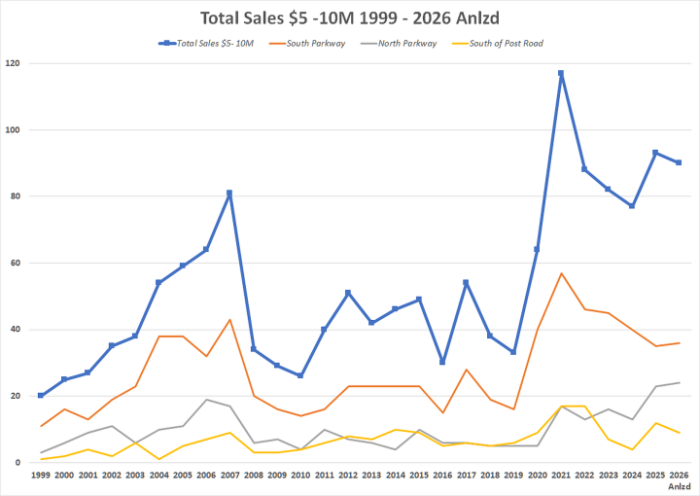
Last year Greenwich set an all-time record for sales over $10 million with 38 sales, double our previous record of 19 sales in 2007. People like to talk about the most, the biggest, the highest, the largest, but in many ways, the $5 – 10 million is more significant. In 2025, we had 93 sales between $5 and 10 million or 145% more sales in that price range than we had above $10 million.
When you total up the sales prices of the over $10 million sales and the $5 – $10 million sales, the sales volume comes out to almost the same amount, right around $600 million. Compare this to our total sales volume of $2.24 billion in 2025. Over $10 million represents about 27% of our sales volume and so do our $5 – 10 million sales. While our $5 – 10 million sales represent 27% of our sales volume, the 93 sales in this price range represent only 17% of our number of sales.
When you look back historically, our sales between $5 and 10 million fall into 3 distinct eras. If you go back to 1999, the earliest year that the Greenwich MLS has data, we only had 20 sales that year in the $5 – 10 million price range. Then again, the average sales price in 1999 was only $1.34 million. So far this year, our average sales price is $4.99 million. (Most of that high average sales price is due to lack of inventory under $1.5 million.)
From 1999 to 2007, Greenwich’s go-go digits decade, sales over $5 million climbed steadily peaking at 81 sales in 2007. In 2008, sales from $5 – 10 million crashed to only 34 sales. Now, the Great Recession didn’t really kick in until September of 2008, but the smart money saw the warning signs and pulled back earlier in the year.
To be fair, a lot of hot shot financial types bought in 2007 and the first half of 2008, when the price/sf for the $5 – 10 million segment hit $895/sf. On a per sf basis, these folks wouldn’t see a higher price/sf until 2023. Having said that, you have to be careful with numbers when you are looking at price ranges that aren’t either the highest or the lowest price range, because of floaters and sinkers.
From 2016 to 2025, the average price/sf for houses between $5 and $10 million rose from $791/sf in 2016 to $1,000/ sf last year. That sure sounds like a strong trend and it is, but floaters into and out of this price bracket changed what was actually selling. A lot of houses that were $8 and $9 million in 2016 appreciated to greater than $10 million and aren’t in this analysis. At the same time, a bunch of $4 million houses in 2016, had become $5 million+ houses by 2025.
One way to check this is to look at the size of the houses that were selling. For most of the period from 1999 to 2020, houses in the $5 – 10 million range were on average between 8,000 and 9,000 square feet. Only in the recession years of 2009 and 2010, could you get a bigger house in that price range and then it was only a few hundred square feet bigger.
This changed with Covid. Since 2021, the average size of a Greenwich house sold between $5 and $10 million has dropped steadily as houses have gotten more expensive. Last year, the average size house in this price range was down to 6,943 s.f., which pushed the average price/ sf to $1,000/sf, its highest ever. So far this year, our average price/sf has dropped to $947/sf and the average size house has increased to 7,967 s.f.
Is this a worrying trend? Not so far, these number only represent the first four months of 2026. A year, that so far has had a lot snow and cooler temperatures, a dysfunctional Congress and plenty of international intrigue.
Also, high-end buyers are fair weather buyers and it’s supposed to be an El Nino year, and possibly even a super El Nino. There is nothing like blazing hot New York sidewalks and subways to make a couple of acres of grass in mid-country look good.
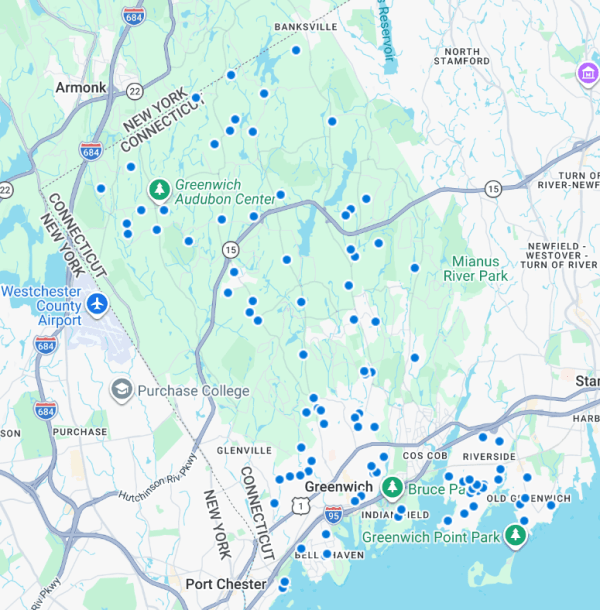
The house is likely to be in mid-country if you are buying in the $5 – 10 million range. Part of this is the GMLS calls everything from the Merritt Parkway to the Post Road “South of the Parkway”. It is by far the largest part of Greenwich. Last year we had 35 sales between $5 and 10 million South of the Parkway. The next nearest area was backcountry, aka North of the Parkway. In 2025, we had 23 sales in backcountry in that price range.
Backcountry and :South of the Post Road” (Belle Haven, Mead Point et al) generally have similar sales except in good times. Backcountry did much better from 2004 – 2008 and also been doing better than South of the Post Road since 2023.
We are also seeing more sales over $5 million in both Old Greenwich and Riverside even off the water.
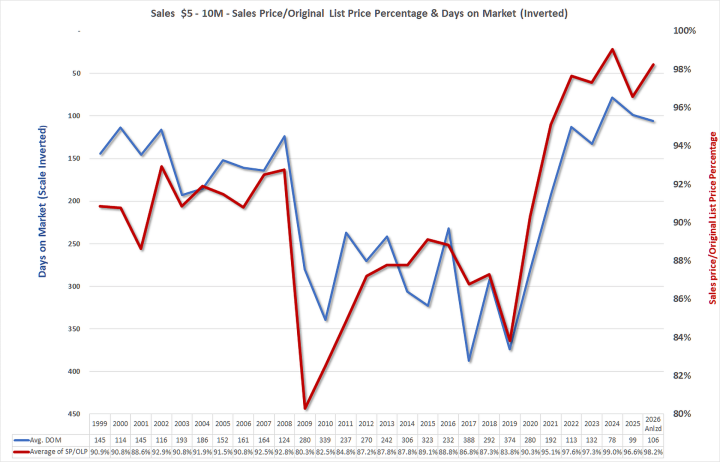
At the present time, we have 30 listings between $5 and $10 million, all of them are in mid-country or backcountry except for one listing in Old Greenwich and one in Riverside. To show how tight the market is even at these high levels we 27 contracts in that price range.
To buy, move fast and bring cash.
Mark Pruner is a sales executive with Compass Connecticut. He can be reached at 203-817-2871 or mark.pruner@compass.com