By Mark Pruner
There are a lot of statistics in real estate, and they can be manipulated to tell different stories. Gleaning the gold from the lead is not always easy. For example, last month was one of the worst months in Greenwich real estate in the 21st Century. We only had 19 single family home sales in March. The only months that saw lower sales were from November 2008 to March 2009, the heart of the Great Recession. Our single-family home sales hit their nadir in January 2009 with only 7 houses sales in the entire town of Greenwich. So, what can statistics tell us as to why 2025 is not the Great Recession part II even though March 2025 sales were not good?
Overall house sales by month
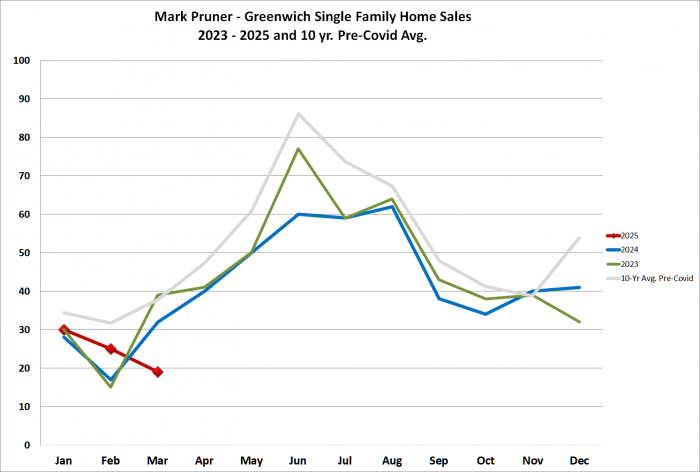
Let’s look at the monthly sales stats in more detail. One graph you see quite a bit in my Greenwich Sentinel column is the number of single-family home sales by month. The graph I usually use has home sales for each of the last two years, plus the current year to date and the 10-year average. What is not included in, but you often see presented elsewhere in monthly sales numbers are co-ops, condos and sometimes even multi-family and land. If you are on the BET or the Town Clerk and you want to see if conveyance taxes are going up or down lumping all types of real estate together is fine, but it’s not so good if you want to know how your house is doing in this market.
Mixing up different types of property
Condos, land and multi-family all have different types of buyers with different supply and demand curves. There is some overlap but generally house buyers don’t look at condos and families looking to buy land and build a new house don’t look at multi-family investment properties. Lumping them together muddies the state of the house market, and due to the size of our house market, the other market stats are muted by the housing market.
You often see this housing stats about the “residential market” which includes not only houses, but condos and co-ops. If you are looking to buy a condo, that is not the number to look at. If you are looking to buy a house realize that including the lower priced condo units will throw many other stats such price/sf out of whack. So, when you see a sales number, check and see what types of property are included, mixing property types sends mixed signals.
Month to month comparisons in a seasonal market
The other thing you often see on real estate sites is month-to-month comparisons. These also are not very useful in Greenwich as we have a major seasonal element to our sales as you can tell by the 10-year average line for single-family homes in Greenwich. The odds are very good that nearly every year, March sales will be higher than February sales and that November sales will be lower than October sales. Whether sales are up or down from the prior month generally doesn’t tell you very much, because of most of the time the change from month to month is due seasonality.
If the change is different than the 10-year curve would predict, then something likely is happening and that’s what we saw this March. In the 10 years before Covid, sales on average went up 18.9% from February to March. This year March sales went down 24%. Not only were sales very low in March, but they were also changing at a very rapid pace from February.
While sales were down from February to March, if we look at contracts, the best predictor of future sales, then our market is doing fine. But what about that big sales drop in March. For anyone who has been following the news, uncertainty is up, the VIX index is up, and stock prices are down. It’s the latter factor that explains much of the decline in sales this March.
Our median sales price so far this year is $3,850,000, so most of our deals are all cash, but where does that cash come from? For most of our buyers, it comes from the sale of stocks. When the stock market drops sharply, buyers delay their closing hoping the stock market will come back so they don’t have to sell so many shares. This explains why sales, but not contracts, are down. Buyers under contract are delaying closings, which they can do under the standard Fairfield County Bar contract for 10 days without penalty. They then have a penalty of 1/30th of 1% per day of delay up to 30 days, before they are in default under their purchase agreement.
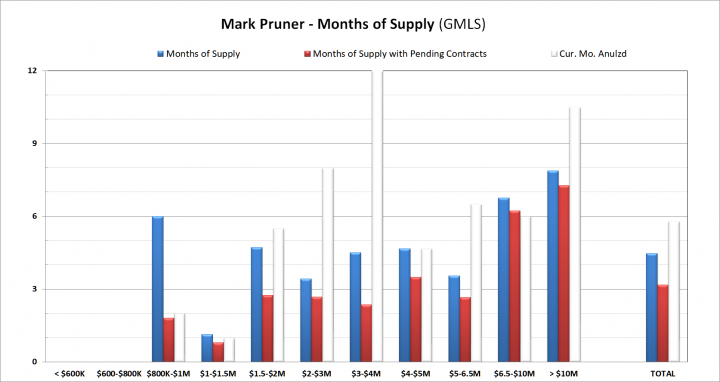
Differences Among Months of Supply
Months of supply is also another very useful way to look at the overall market and at particular segments of the market. The good thing about MoS is that it includes not only sales, but the current inventory. Month of supply sets out how long it would take to sell our present inventory based on the prior sales rate. For an easy example, if we had sold one house a month so far this year and you have 9 house in inventory then you have 9 months of supply.
You can also calculate months of supply in different ways, such as only actual closed sales, sales and contracts, or just last month’s sales annualized. If I am representing the seller, I like to see each of these number decline. For example, our March closed sales numbers show that from $6.5 – 10 million, we have 6.8 months of supply, which shows a balanced market.
When you add in the 5 contracts waiting to close and assume they will all close in an average 45 days you get 6.2 months of supply, even better. The good news is that when you annualize the three March sales in this price category you are down to 6.0 months of supply. This market is improving, while all the other prices ranges saw poor March sales and higher DOM based on annualizing these poor March sales. April contracts continued to rise throughout the month as they are supposed to do in the spring market. Bottom line, the Greenwich housing market is not signaling that we are going into a recession in our real estate market.
Days on Market
Months of supply is sometimes confused with days on market. If you total up the number of days each house was on the market and take the average, you get days on market for the whole market. If each house came on the market and sold on average in 45 days, then you have 45 days on market (DOM). The lower the days on market, the hotter the market, as buyers snatch up houses within weeks or days of coming on the market or conversely in a slow market houses sit for months without selling.
For the month of April MTD our median days on market is 18 days on market. This is a sign of a hot market. In a hot market, well-priced, newer houses sell quicker than the over-priced houses that sit on the market.
Curiously, the average days on market initially goes up in a hot market as houses that have been on the market for months and years are finally finding buyers. This is a number where the difference between the average and the median days on market can be quite large. All you need is for a couple of houses that have been on the market for 1,000+ days to sell and the average days on market will jump while the median DOM will barely budge. That’s what we see in the first quarter of the year as new listings mainly come on in March and April. What is selling are listings that have over-wintered and push the median days on market, which means in the first quarter a rise in days on market, doesn’t mean a slowing market.
Days on market varies significantly by price range. The lower the price range the lower the days on market. We also see the same effect in months of supply. The rough rule of thumb is that months of supply under 6 months are a seller’s market, but you get over $5 million and sellers start feeling good when months of supply drops below 12 months.
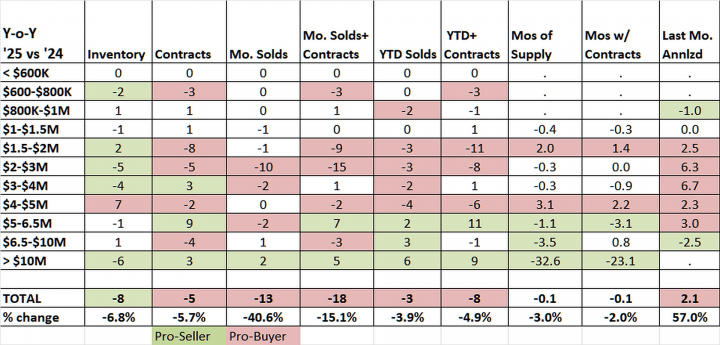
High-End Sales Take Sharp Jump Up
Sellers are feeling pretty good this year at the high-end of the market. In 2024, we only had 2 sales over $10 million totaling $29.5M, while this year we have had 8 sales over $10 million totaling $131.6 million. This is a 400% increase in sales and a 446% increase in sales volume. (Our team helped as we have the highest sale this year.:) It looks like some money may be moving from the stock market to high-end Greenwich real estate.
Using Real Estate Stats to Make Decisions
So, if you are thinking about listing your house or considering buying, what numbers should you look at? Here’s a quick 5-point check list:
1. Are overall are sales and inventory up or down?
2. How are sales and inventory changing in your area and your price range?
3. What is the months of supply for sales, what about with contracts added in and with the prior month annualized?
4. What is the difference in median sales DOM and inventory DOM year-over-year? Is it getting better or worse over the last few months?
5. How is your market doing on a year-over-year basis and against the 10-year average?
The important info is in the details.
For the seller, months of supply and days on market are significant factors in how aggressively you have to price your house. When these numbers are high you want to be at the lower end of price per square foot and have better staging than your competition. For buyers, you can afford to be more aggressive in your negotiating, particularly where you have other options that are satisfactory.
But numbers are just numbers, when it comes down to one-on-one sales negotiation. When you are negotiating you want to know the needs of the other persons, their personalities and their stress tolerance. In negotiations, these are often more important than how soft or weak the market is. Knowing the numbers and knowing how to negotiate in the Greenwich market is what gives you the best result, a sense of control and can even make buying or selling a house fun.