By Mark Pruner
Market Stays Tight
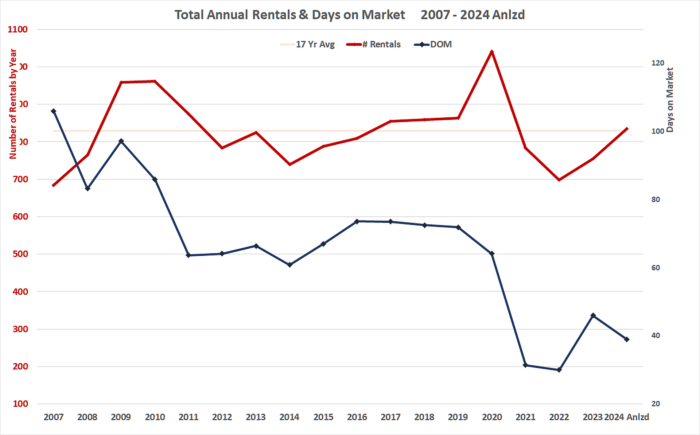
Rentals are back to average, well, almost. What is almost back to average is the number of rentals that have been reported on the Greenwich MLS. So far this year, we have had 601 rentals through the middle of September. If you annualize that number, you get a likely 835 rentals for the year. This compares to an average of 829 rentals per year going back to 2007. So, this year we are likely to be just over our 16-year average. Given what we have been through, average is good.
Going back to 2007, we’ve had four “abnormal” periods; two up and two down. Rentals dipped in the go-go digits’ decade; people bought rather than rented. In 2007 at the peak of house sales, we had only 684 rentals, which was 17% below the average for our next 16 years. When the Great Recession killed the economy, rentals showed their counter cyclical nature and ticked up in 2008 and then took off in 2009 and 2010 with 959 and 962 rentals in those two years. When people are uncertain, they rent rather than buy, particularly, as during that time period we were seeing house prices drop. This was one of the few periods where we saw Greenwich house prices drop in the last 50 years.
As people started to recover from the Great Recession, we saw seven years of “normal” rentals close to the 829 rental average. Then came Covid, and rentals skyrocketed. In 2020, we had 1,041 rentals on the GMLS, which was 26% above the average. We would have had more, but there were only so many people who wanted to rent out their houses and condos. Having said that, a couple of hundred homeowners who hadn’t ever considered renting their Greenwich homes decided that at the prices tenant were willing to pay, these homeowners figured they could hang out in their second homes and rent out their Greenwich home.
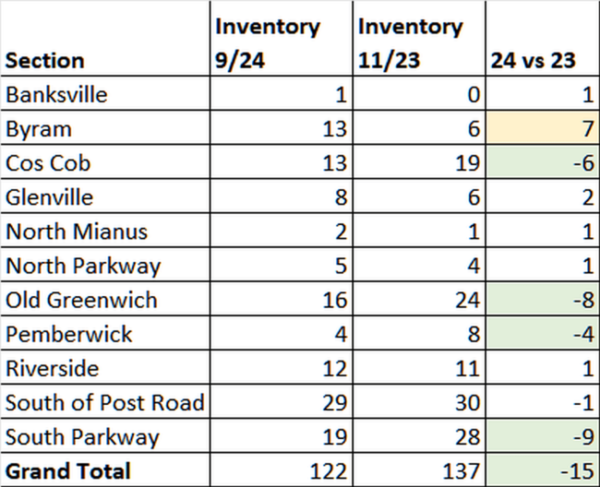
This year continues the unique nature of the Greenwich rental market, but in a different way. Our rental inventory has shrunk this year compared to last year, but the number of rentals has gone up. At present, we have 122 rental listings on the Greenwich MLS. This is down from the 137 listings that we had in November last year. (NB: The careful reader will note that I just compared September 2024 to November 2023. I usually only write about rentals a couple of times per year, unlike houses that I write about a couple of times per month. As a result, the stats about rentals don’t tend to match up with the exact same month in the prior year. The dissimilar months comparison still illustrates what is going on with rental as rental inventory is a flatter sine wave pattern, unlikely the peaky house inventory.) Our rental inventory, like house inventory, tends to peak in the late spring and into the summer. While the 122 listings are low for Greenwich it is still 3 times the inventory that we had in April 2020, when we reached an all-time low of 42 listings.
You would think with fewer listings and more leases signed that, we would see our days on the market fall, and you’d be right. It is not quite as low as what we saw in 2021 and 2022, when rentals were only staying on the market for an average of 30 days, but it is still a strong indicator of a landlord’s market. So far this year, we are looking at a DOM of 39 days. That’s down from last year’s DOM of 46 days and well below our 17-year average of 68 days on the market.
Yes, we have had more supply as indicated by the increase in the number of signed leases, but we also have seen more demand. When mortgage interest rates go up and economic times are uncertain, people rent. What’s unusual this time is that our single-family home sales market is tight at the same time due to record low inventory.
In 2024, we saw a jump in lease signings in just about every price range. The two exceptions were rentals from $4,000 to $6,000 where a drop of 11 rentals meant a drop of 7% in activity. The other price range where the number of rentals dropped is the over $20,000/mo rentals where the number of rentals are likely to drop from 56 rentals last year to 44 rentals this year. I say likely to drop as the 44 rentals for all of 2024 is based on annualizing the 32 leases signed for over $20,000 rentals that we have had through mid-September.
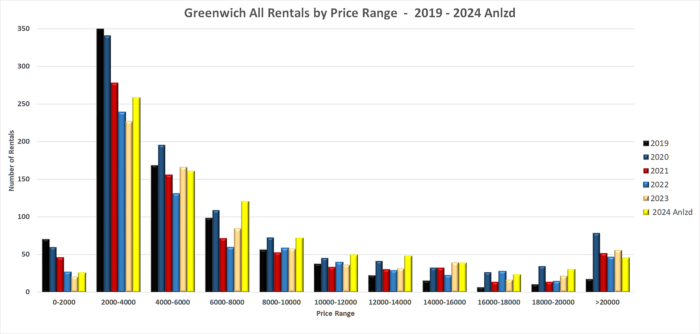
Most of the rentals under $4,000 are apartments, often with shared hallways and elevators, which is not what people wanted during Covid, so rentals under $4,000 fell during Covid. Close quarters during Covid were not the only reason that rentals under $4,000 fell. The number of rentals under $4,000 and particularly under $2,000 also fell because of the rise in rental prices, moving these rentals into higher price ranges.
In 2019, we had 71 rentals under $2,000. If you annualize this year’s rentals under $2,000, you get 25 rentals which is actually an increase from last year. This seeming contradiction can be explained by the fact that a lot of people who had moved out of NYC into apartments in Greenwich are now moving up to buying a house. There is more supply of lower-end rentals as these units which had been rented out for multiple years come on the market. We have plenty of demand to absorb this increase in inventory. (NB: The low-end of the Greenwich rental market is always problematic to get a good handle on as many of Greenwich’s lower priced rentals don’t get listed on the MLS.)
Over $20,000 per month pre-Covid, we had 18 rentals in 2019. When Covid hit in March of 2020, the number of high-end rentals jumped to 71, an increase of 294% in one year. High-end rentals dropped back to 52 rentals in 2021 and 47 rentals in 2022, staying high but stabilizing somewhat. In 2023 we had 56 rentals over $20K/month.
This year, we are on a path to 44 rentals over $20,000/month. As of this week we have had 32 listings rent for $20K+. Of those 32 high-end rentals, 12 of them were summer rentals and one was a short-term rental. Traditionally, summer rentals went from Memorial Day to Labor Day. With more people working from home, summer rentals may now start May 1 and run to September 30th or even into October. Our highest rental this year was a backcountry summer rental that went for $80,000/month.
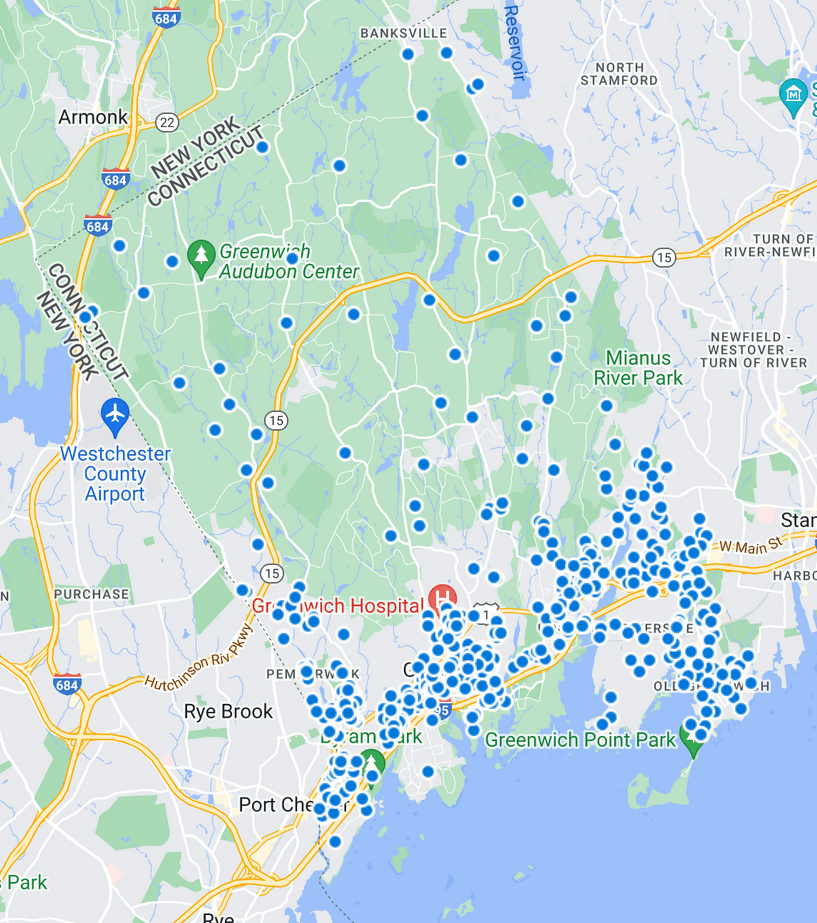
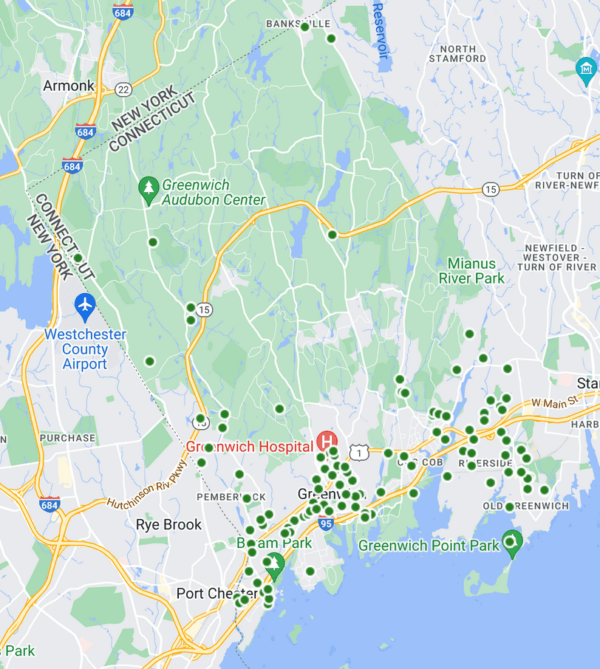
Most of our rentals are concentrated in our smaller zones. Of course, part of that “concentration” when you look at a map is an optical illusion, as 14 lots in the R-12 zone in Old Greenwich could fit into one RA-4 zoned lot in backcountry. We have four areas where our rentals concentrate: South of the Post Road (25%), South of the Parkway (16%), Old Greenwich (15%), and Cos Cob (12%). Curiously, Riverside has only about half of the rentals that Old Greenwich has had so far this year.
While we have more rentals this year, our days on the market are still historically low, so finding the perfect rental is still tough. (If anyone wants to rent a downtown condo, please call me or your favorite agent as downtown condos are still the holy grail for rentals.)
When you look at where rental inventory is concentrated, most of it is concentrated along or near the Post Road. Byram and Pemberwick also have a fair number of rentals. Downtown continues to be the place to find rentals. Having said that if you compare backcountry’s 29 signed leases to only 4 houses in inventory, you need to be ready to move quickly, when the right rental comes on north of the Merritt. Then again given our low inventory and high demand, that is true of every part of town.
Mark Pruner is a sales executive and part of the Greenwich Streets Team at Compass real estate. He can be reached at 203-817-2871 or mark.pruner@Compass.com or at his office at 200 Greenwich Ave.