By Mark Pruner
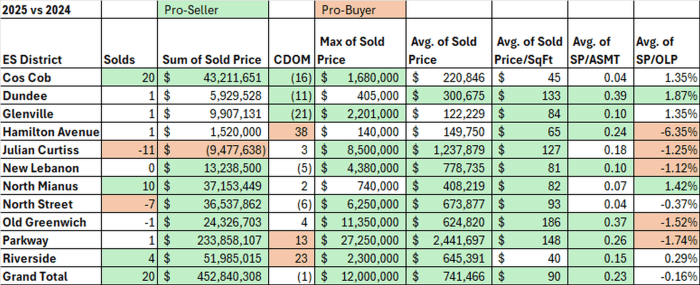
When you look at the total 2025 sales in Greenwich, it looks similar to 2024 with 519 versus 500 sales. However, when you look at the town by neighborhood, you see some big differences. In 2025, every neighborhood saw higher sales prices and lower inventory as demand exceeded inventory by a wide margin. Every neighborhood saw an increase in the average sales price in 2025. Some neighborhoods saw average prices jump by more than $1 million. The Parkway school district (think back country and mid-country just below the Merritt Parkway) saw the average price increase by $2.44 million.
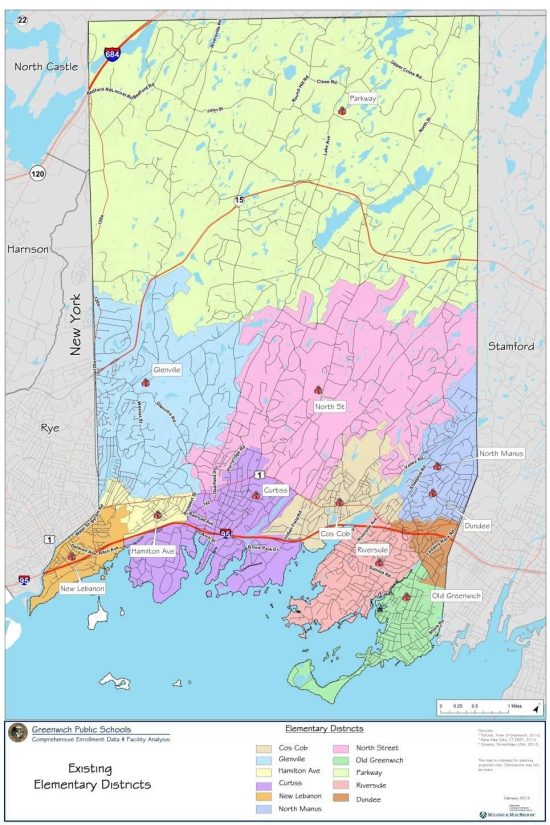
(First, however, the standard disclaimer. I’m using the school district boundaries, because they are more useful than Greenwich’s 12 voting districts or 11 GMLS districts. The main reason is that a third of all the sales reported on our MLS are in the South Parkway section. This section runs from the Merritt Parkway to the Post Road and from the Stamford border in the east to the New York state line in the west. The school districts divide this huge area into three school districts, Parkway, North Street and Glenville, which means better neighborhood analysis. When discussing these districts, I’m dropping the “school” since I’m only interested in the borders rather than the elementary school that gives each district its name.)
Most sales
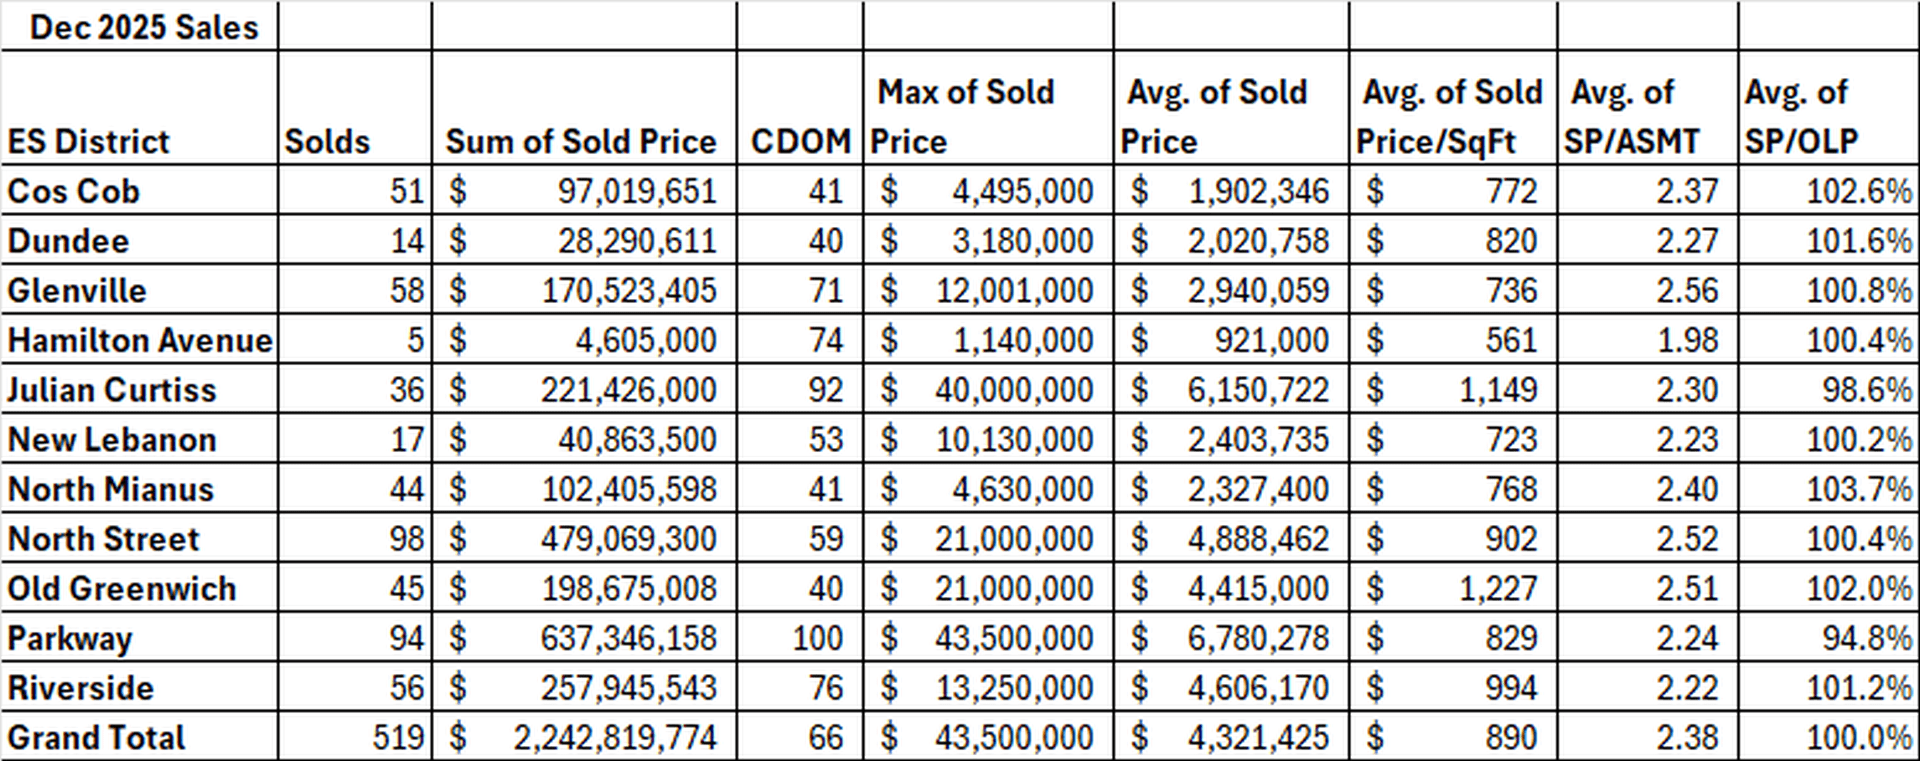
The North Street district in central mid-country continues to be the district with the most sales. It had 98 sales this year, but this was down from last year’s 105 sales. Parkway also saw 94 sales, which was up one sale from 2024. In other words, backcountry and mid-country led sales in both 2024 and 2025. People want land again and with the stock market setting record highs, they had the money to pay for them.
The district with the biggest increase in sales was the Cos Cob district. In 2024, Cos Cob had 31 sales. In 2025, Cos Cob saw an increase of 20 sales to 51 sales. We had more inventory come on this year in Cos Cob and more inventory means more sales in this hot market. The reverse is also true. In the North Street district lower inventory led to lower sales. It’s actually remarkable that it did as well as it did given the drop in inventory.
Demand was strong, while supply dropped resulting in the median sales price townwide going up almost 10%. Two years ago in 2024, the average sales price in the North Street district was up to $4.21 million, an increase of $594,336 over 2023’s average sales price or 16.4% in one year. In 2025, the North Street school average sales price was $4.89 million or a further increase of 16%. NB: These average price increases are somewhat distorted by the big increase in sales over $5 million.
Coming in second for sales was the aforementioned Parkway district. When you look at the Parkway district, you might say of course there would be a lot of sales there. the Parkway district is our largest district. It has over a third of our land mass. It is, however, our lowest density zone as houses sit on 4 acres and 2 acres.
One factor driving Parkway sales is that it has the highest number of listings with 17 houses on the market at year end. The next highest district is Julian Curtiss with 12 listings. After that every district is in single digits for inventory.
The Parkway district is arguably less pro-seller than other areas as it has our lowest sales price to original list price ratio. The average house in the Parkway district sells for only 94.8% of its original list price. Also, in backcountry the average sales price/s.f. is only $829/s.f., which is exceeded by half of the districts further south. A major factor as to why the Parkway district has a middle of the road price/s.f. is that most of those houses have a lot of s.f. Additional square feet, particularly in older homes and home styles that are less favored by today’s younger buyers sell for less per square foot.
In 2025, that changed. That “lowly” price/sf of $829 is up a town leading increase of 21.8% over 2024. This compares to average townwide increase in price/sf of 11.3%. Big houses are back in vogue and the ones in backcountry and mid-country had a banner year.
Highest price
You can look at highest price in two ways; the house that sold for the most money and the district that has the highest average price. In 2025, the house that sold for the highest price on the Greenwich Multiple Listing Service was 214 Clapboard Ridge Road that sold for $43.5 million. This was new construction with 26,387 sf. Not far behind was 579 Indian Field Road, a 2013 waterfront house with “only” 11,500 sf that sold for $40 million.
In total, we had 39 sales over $10 million. Those sales were concentrated in the Julian Curtiss, North Street and Parkway districts. The Julian Curtiss district had both the second highest sales price and the highest average sales price at $6.15 million.
However, averages can be deceptive when the distribution is skewed. In the Julian Curtiss district, we had 36 sales. Seven of these sales were in our gated waterfront communities and all those sales went for over $7 million. The district also had 11 sales under $3 million. The median price for all sales in this district was $4.8 million, well below the $6.15 million average sales price for the Julian Curtiss district. The highest average sales price was in the Parkway district at $6.78 million. These were the only two districts with average sales prices over $5 million.
Highest Price/s.f.
You might think that the Parkway district with the highest average price for house would also have the highest price/s.f. Alternatively, Julian Curtiss might have the highest average price/sf with all those high-end waterfront houses. People love waterfront houses and are willing to pay a premium for them to the tune of $1,149/s.f. However, it turns out that Old Greenwich again this year has the highest price/s.f. at $1,227/sf. In OG, you get a fair amount of waterfront, but you also get the village of Old Greenwich and two great parks in Greenwich Point and Binney Park.
It was a great place for Russ and me to grow up and it is arguably the hottest place on the east coast for successful young families. In Old Greenwich, the average sales price to original list price is 102%, but that is only the second highest in Greenwich. The highest sales price to original list price percentage was in Cos Cob with 102.6% above original list price.
This is impressive and is a result of the biggest jump in sales of any district, but every district, but two had an OLP/SP of over 100%. Those two districts were the ones with the average sales price, Parkway and Julian Curtiss. It’s not unusual for these high-end houses to list at an aspirational price at the request of their very successful owners.
Most affordable houses
So where can you find the most affordable houses? The short answer is not anywhere in Greenwich. Right now, we have no single-family homes listed for less than $1 million. Last year we had 19 sales under $1 million, but this was out of 519 sales or only 3.7% of our sales. All but 1 of those 19 sales were in the New Lebanon, Hamilton Avenue and Glenville districts. Our most affordable houses are in the southwest corner in the New Lebanon and Hamilton districts, but in reality, it is only the New Lebanon district, where we find our most affordable houses.
It’s great that we are seeing house prices rise for our long-term homeowners. Lots of people have lots of equity in their houses. Even people who only bought in the last 5 years have seen major appreciation. In 2019, our median sales price was $1.87 million; by 2025, the median price had risen to $3.15 million. This is a 68.5% increase in 6 years. This won’t continue for many more years, but it makes for an interesting/challenging market with very little inventory.
Stay tuned our inventory is up 13% already this year from 54 listing on January 1 to 61 listing on January 14th. It’s going to be an interesting year.
Mark Pruner, along with his brother, Russ Pruner, and Dena Zarra are the founders of the Greenwich Streets Team at Compass Real Estate. He can be reached at 203-817-2871 or mark.pruner@compass.com.