By Mark Pruner
A funny thing happened to the Greenwich real estate market over the last three years; our sales went down while the amount of the state conveyance tax went up and did so dramatically this year. This happened because our state conveyance tax is tiered from 0.75% to 2.25%, while our municipal conveyance tax is fixed at 0.25%. The town did get a nice bump in conveyance taxes paid so far this year as total sales went from $286.4 million last year to an amazing $383.6 million this year in the first quarter.
The state, however, did very well as the conveyance tax over $2.5 million is 2.25% on the amount of the sales price over $2.5 million. Under $2.5 million, the state conveyance tax is only 1.25% and under $800,000 the state conveyance tax is only 0.75%. (The median sales price for all houses in Connecticut is a little over $400,000.)
The rumor is that this increase in conveyance tax was a tradeoff for not enacting a higher top tax rate in Connecticut, which is presently 6.99% for income over $1 million for joint filers. So, our high taxpaying homeowners were encouraged to stay in the state or at least not move to New York where the top state tax rate is 10.9% over $25 million and 9.65% over $2.16 million.
But wait, it gets even better for Nutmeg state sellers in the upper half of our market, if they stayed loyal to Connecticut. If a Connecticut resident had to pay conveyance taxes at the top 2.5% rate, they could get it back if they stayed as Connecticut residents for 3 years over the next 3 years. If you sold your Connecticut house for say $12.5 million, you would have $10 million taxed at the highest 2.5% rate or $250,000 that you would owe to the state. Starting in the 4th year that seller could get a third of the $250K back each year for the next 3 years. Check with your accountant if you sold three years ago to see if you are due a refund, since it’s not quite as simple as explained here.
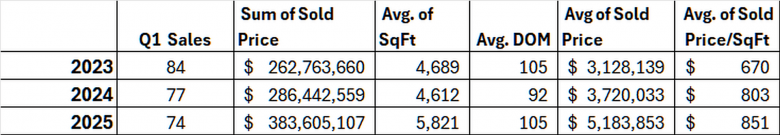
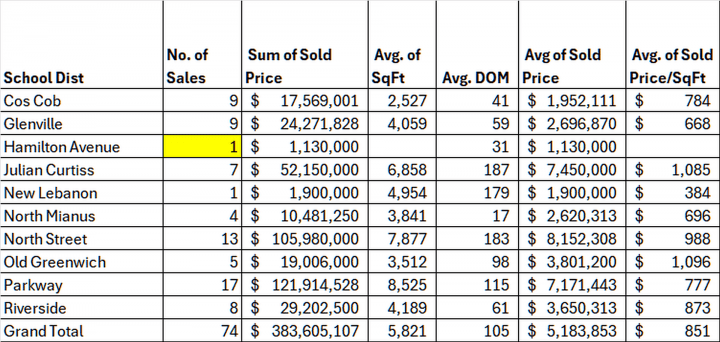
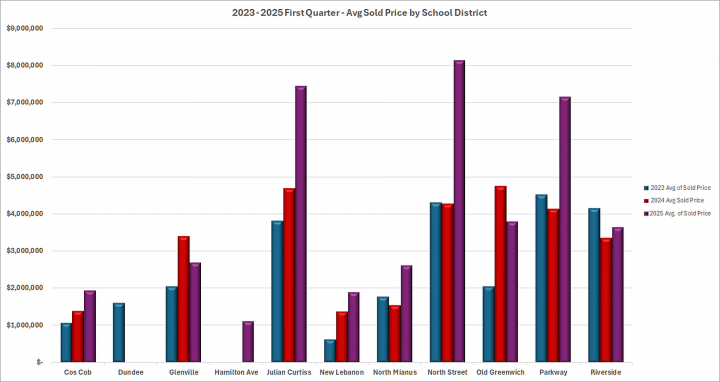
You might be asking yourself, why I am going in to all this detail about an obscure tax provision that probably only applies to at most a couple of hundred people. That’s because, there is not all that much to write about when comparing this year’s sale by neighborhood (using our 10 elementary school districts as a stand-in for neighborhoods). Part of this problem is that we only had 74 sales in the first quarter this year. Divide that by 10 districts and you have less than a dozen sales in every district but Parkway and North Street school districts. And, while we have 13 sales in the North Streets district so far this year, it’s down from 23 sales last year, but is almost the same as 14 sales in 2023.
This is just a long-winded way of saying that everything is bouncing around. We do have a couple of clear trends. First, high-end sales are up from 12 sales in the first quarter of 2024 to 23 sales in the first quarter this year. Since our high-end is so high, it can result in a dramatic increase in the average sales. That is what we see in Julian Curtis, North Street and Parkway districts. All three saw the average sales price jump in Q1 2025. The biggest jump was in the North Street district where the average sales price went from $4.23 million to $8.15 million. Our Greenwich Streets Team at Compass had a $21 million sale (the highest so far this year) and we also had Mary Tyler Moore’s sale at $16.9 million and a third sale at $10.6 million. In Q1 2024, we only had one sale in the North Street district over $10 million at $15.9 million.
The other trend is that the average sales price per square foot is continuing to rise in most districts. Overall average price/SF is up 5.9% this quarter compared to Q1 2024. We see the average price/SF up in Glenville, Julian Curtis, North Mianus, North Street, Old Greenwich and Parkway. Our days on market are more mixed, but in several districts, the rise in the average days on market is due to a few listing queens finally selling that have been on the market for a year or two.
While our economic situation continues to be muddled, we should have better numbers by the end of the second quarter so stay tuned.
Mark Pruner is a sales executive and part of the Greenwich Streets Team at Compass real estate. He can be reached at 203-817-2871 or mark.pruner@Compass.com or at his office at 200 Greenwich Ave.