By Mark Pruner
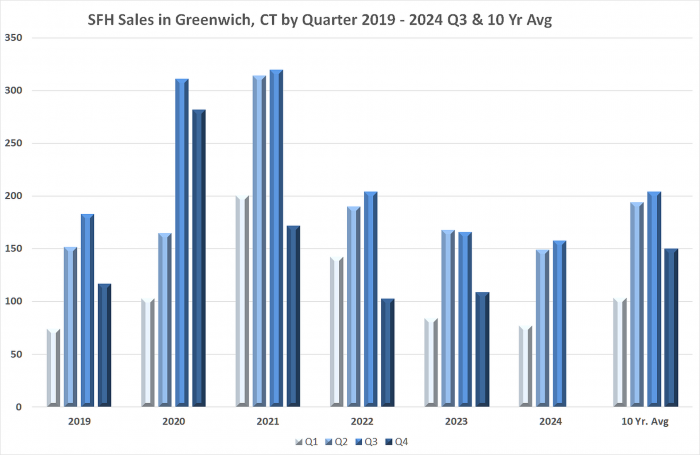
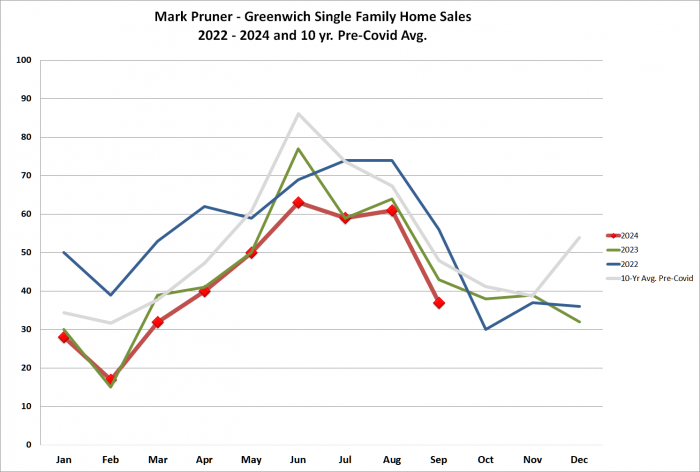
When you look at a chart of sales in Greenwich by month, you see the steepest slide in sales this year happening last month. We went from 61 sales in August 2024 to only 37 sales this September. This is 23% below our 10-year pre-Covid average of 48 sales in September.
As to that big drop, in September sales, you can blame people who send their kids to camp, who go on vacation and visit their relatives in August. There just aren’t that many people in Greenwich in August, (which is why it is the best time to get a parking spot on Greenwich Avenue). August is just a slow month for contracts and for new inventory. In August, both drop, and then comes back in our fall market in September.
In September, sales drop, because the pump wasn’t being primed in August, fewer new listings, leads to fewer contracts and by September the chickens come home to roost. More accurately stated its the lack of eggs in August, which leads to the lack of chicks and the lack sales in September.
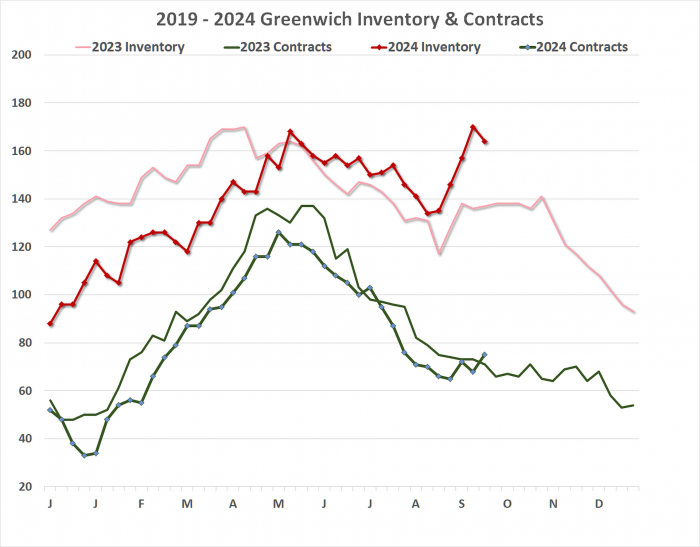
Inventory jumps in September, followed by contracts
Luckily, we got a supply of eggs in September, as we actually got more new listings than we got contracts, which is what happens normally in our fall market. Our fall market has been practically non-existent the last couple year, but this wasn’t the case this year. This year our inventory went up and on a percentage basis it went up a lot with an of 26.9% in only four weeks. That 170 listings in the third week of September were the highest number of listings for the entire year so far.
As the number of new listings went up, new contracts followed right behind. Our contracts had lagged our weekly number for almost the entire year, and it wasn’t until September, that we saw contracts exceed last years numbers. Unfortunately, our increase in inventory followed, the more traditional fall market path and has once again fallen as we got into October.
The problem with this dramatic analysis is that we don’t sell percentages, we sell houses, and the number of houses went up only 36 listings. So, we had a few more houses peaking at 170 listings in the third week, but same week in 2019, we had 620 houses for buyers to choose from. This means that buyers had 3.6 houses to look at for every house we have now or alternatively, inventory is down 72.6%. It wasn’t that much of a peak, except on a percentage basis.
Third quarter has weak sales
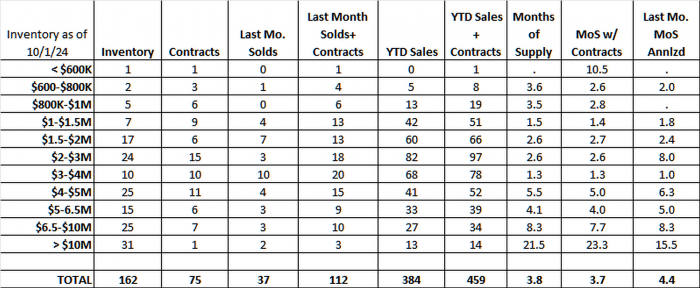
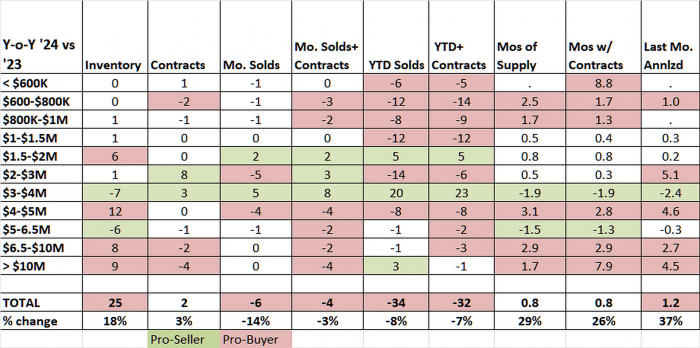
For the third quarter of 2024, we had 157 sales compared to 166 sales in the third quarter of last year or a slight drop of 5.4%. YTD we have 387 house sales which is down 34 sales or 8%. Each quarter this year has been just a little weaker than the same quarter last year. If you go back to 1999, only 3 third quarters had weaker sales including the recession year of 2009 and 2011 and 2017. We are on a path to end the year with 502 sales which would be out lowest number of sales since the Great Recession year of 2009.
If we do continue to see more inventory this year than last year, then there is a good chance, that 4th quarter will beat out the 109 sales that we had the 4th quarter of 2023, but will do it by more than 37 sales to get us above last year’s sales? That seems less likely.
Even with the slight drop in new listings, our fall inventory is still doing better with 162 listings, which is up 18% from last year. Due to the extra inventory, our contracts have also risen and are up 3% from this time last year. There is a very good chance that October 2024 sales will be higher than last year, however, don’t forget FUDR; Fear, Uncertainty, Democrats and Republicans. Octobers in presidential election years have traditional been a period where people push closing off until the election is decided.
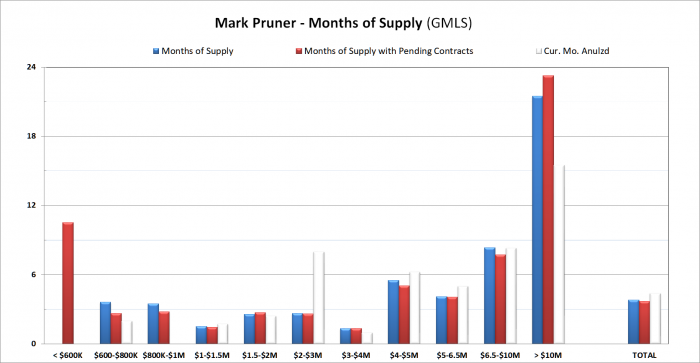
Regardless, we still have very low inventory, which leads to very low months of supply. Overall, we only have 3.8 months of supply, which is still well below the 6 months of supply that we see in a balanced market. The added inventory has pushed up our months of supply from 3.0 months of supply last year, but sellers are still in the catbird’s seat (<- the last bird analogy). The one exception to our overall tight market is the over $6.5 million market which had 56 listings and only 5 sales last month.
Our market from $6.5 – 10 million has 8.3 months of supply up 2.9 MoS from 2023. We have 21.5 months of supply over $10 million, but if you add in the 6 off-market sales our months of supply would drop to 14.7 months of supply. (Our two highest private sales at $19.25 million and $18 million are higher than our highest reported public sale at $16.25 million.)
We are also seeing fewer sales under $1.5 million due to low inventory. We only have 15 listings under that price and 60 sales YTD. This means we are down 38 sales under $1.5 million compared to last year when we had 98 sales. Drop down to $800,000 and we have had only 5 sales and only 3 listings on the market. Part of this is that lots of our lowest priced listings come on and go off in the same month and are never counted in month-end inventories, but much is due to appreciation, pushing many of these house over $800,000.
Our sweet spot this year has been $3 – 4 million, where we are up 20 houses over last year’s 48 sales to a total of 68 sales this year. The result is 1.3 months of supply and with 10 contracts pending. Unless we get a sudden influx of house in that price range, that market will stay tight.
If you go up to the $4 -6 million range you see a little softening, but it is still a seller’s market, but we are in October and for those folks that are serious about selling this year, even a slightly softening market means this is the time to check your pricing and make sure that you have it right.
Over $5 million we only have 14 contracts compared to 73 sales so far this year and inventory of 71 listings. For sellers in that price range, you want to look seriously at a significant price reduction, if you have been on for more than 45 days or if not get some really good professional staging.
With all that is going on in the world and the U.S., we have some significant chances of one or more black swan events, so while the uncertainty, is there, the number say it’s still a good time to list your house if it is less than $4 million. Above, that, even way above that, properly priced and marketed houses still sell quickly.