By Mark Pruner
The Districts that are Up and Down
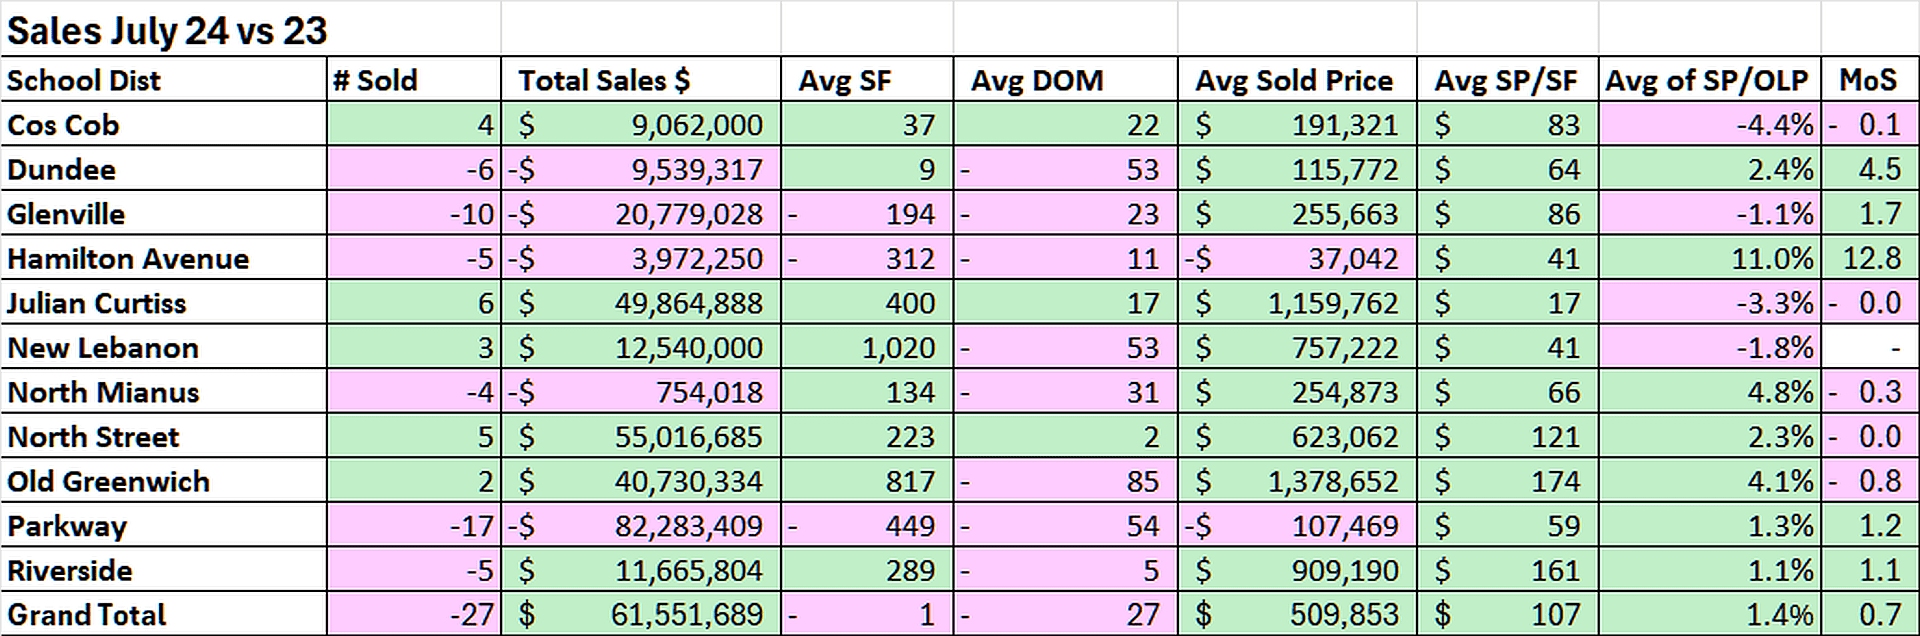
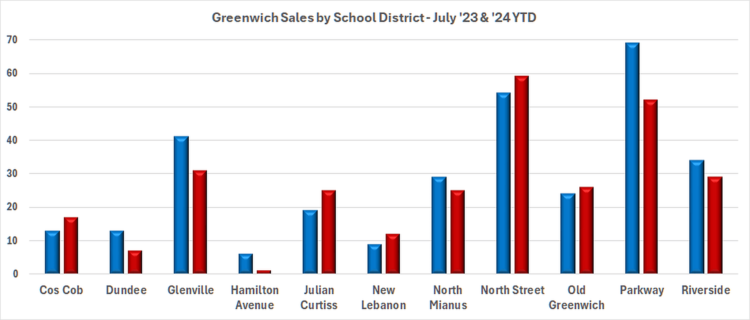
So, how is each area of town doing? We are seeing some dramatic changes. Sales are down in the Glenville and Parkway districts, but Parkway contracts are up, even while inventory is down. Sales are up in North Street and Julian Curtis, while contracts are up in Julian Curtis and down in North Street
What explains all of these seemingly contradictory numbers?
The market is hot and continues to be that way, but it is changing. For the first time in a couple of years we saw town-wide inventory exceed the inventory for the same week last year starting in July. This increase was never more than 12 additional listings for any given week and our inventory was was exceeding last year’s inventory it was actually falling as it normally does in July and August as seller take a summer break.
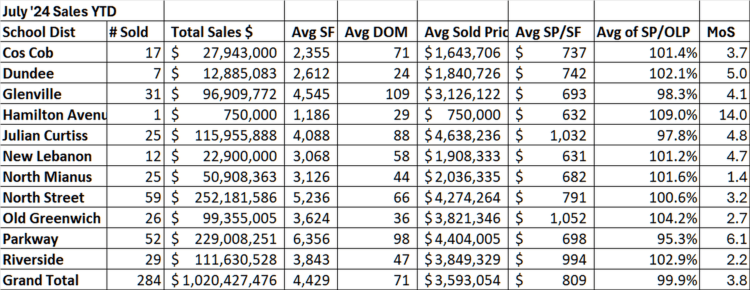
By last week, we were right back where we had been with only 134 single-family home listings compared to 131 listing at the end of August 2023. This compares to the end of August 2019, when we had 609 listings, meaning our inventory was still down 78% from our last pre-Covid year. When you look at days on market, it is sitting at record lows as people jump on new listings. Our sales price to original list price townwide rounds to 100%. (It’s at 99.9%) and is over 104% in Old Greenwich.
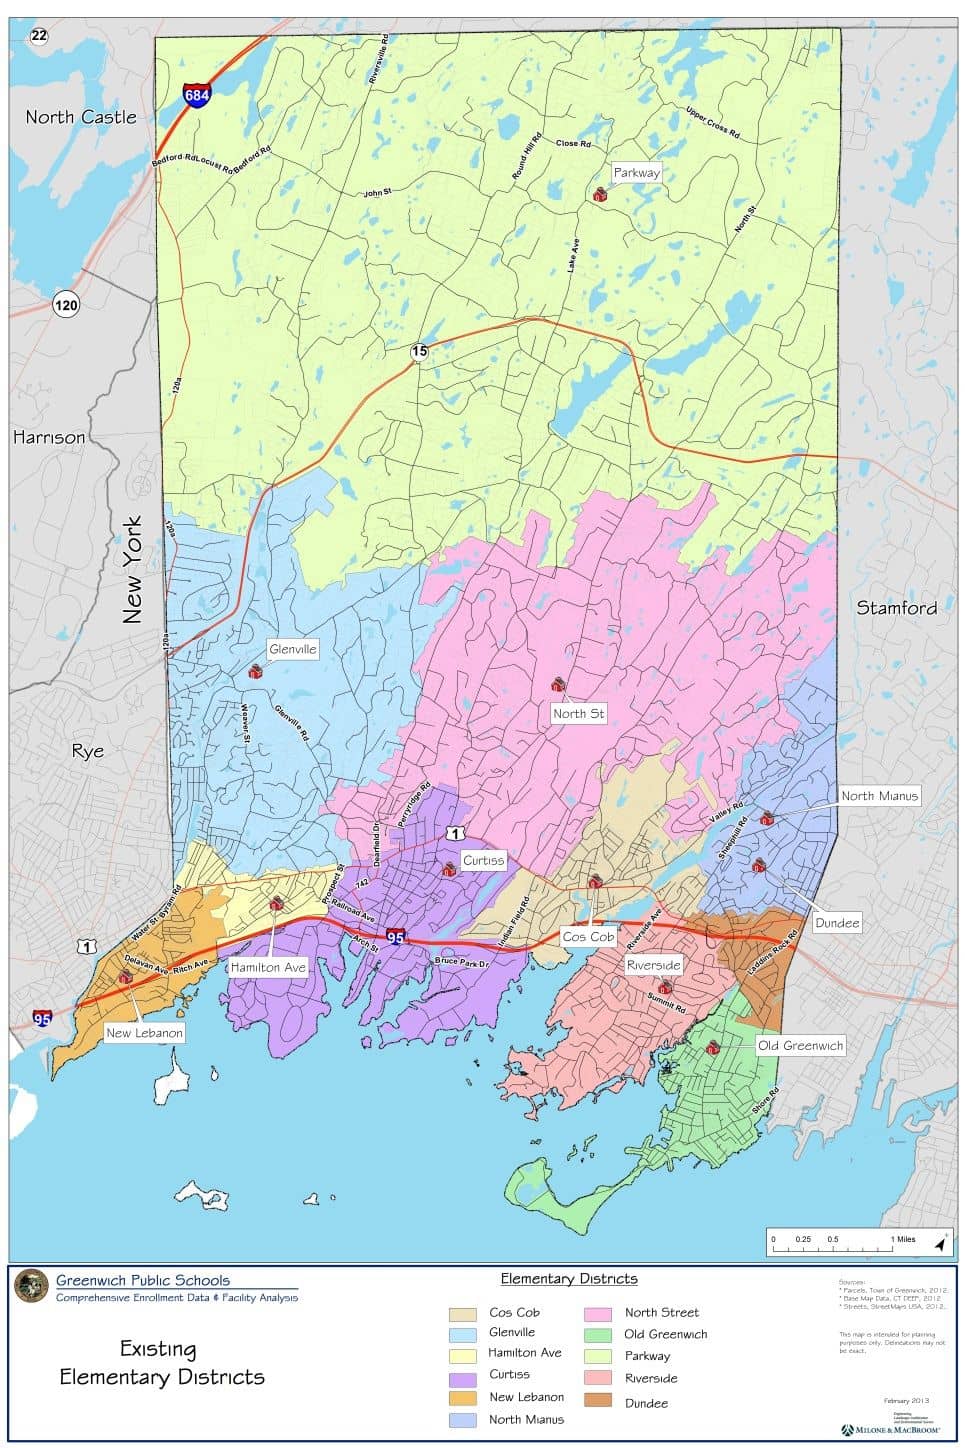
Let’s look at how the school districts have done, but first the standard disclaimer. I’m using the school district boundaries, because they are more useful than the 12 town voting districts, which can ramble all over the place. I also prefer looking at sales by school districts, because, while the MLS has 11 districts, a third of all the sales reported on our MLS are in the South Parkway district. South Parkway runs from the Merritt Parkway to the Post Road and from the Stamford border in the northeast to the New York state line in the west. While this area is divided into three school districts, Parkway, North Street and Glenville.
I’m also dropping the “school” since I’m only interested in the borders rather than the elementary school that gives each district its name. Below, I’m starting with the hottest district based on months of supply and working my way up to the higher numbers, which still aren’t very high. No district is a buyer’s market.
North Mianus
The North Mianus district is north of the Post Road and is the northern end of the Old Greenwich and Riverside zip codes. It is another area where not a lot of houses come on the market and what does come on the market usually sells quickly. So far, we have had 25 sales this year in the North Mianus District, which is actually down 4 sales from last year at the end of July. Sales are down, because inventory is down by 2 to only 5 listings presently resulting in only 1.4 months of supply. This strong demand has driven the average price up by $255K or 14% higher this year to $2.04 million.
Riverside
Riverside only has 2.2 months of supply, our second lowest MoS. Once again sales are down in the Riverside district from 34 sales last year to 29 sales so far this year. Surprisingly, our inventory is up slightly from 5 houses last year to 9 houses this year. The average sale price this year in Riverside is $3.84 million, up 31% from last year. When you see price increases like that from year to year, a large part of what causes these big jumps is the mix of what is selling. When you look at the sales price/sf it is up19%. Still a big increase, but more indicative of what the average homeowner might expect. The average days on market is also down 10%.
Old Greenwich
Old Greenwich and Riverside regularly battle it out for the hottest districts in town. This year, Old Greenwich’s month of supply is 2.7 months, or what I call a super seller’s market. We only have 10 listings on the market, and we have 7 contracts waiting to close.
When inventory gets this low, you can expect that part of the reason is houses selling off market. Russ and I had two private listings in OG where we grew up and they both sold over list and had accepted offer in less than a week for $4 and $5 million dollars. These things don’t just happen. We spent weeks working with the owners, stagers and in pre-marketing to make that happen.
The average sales price/sf is up 29% in OG this year.
North Street
The North Street district, think mid-country east, saw 59 sales so far this year, up 5 sales from last year. This is the highest number of sales of any district in town. The average price is up $623,000 or 17% over last year to $4.27 million. The average sale is going slightly over the original list price at100.6% of OLP. This area hits the sweet spot with 27 listings available for sale and a choice of lot sizes.
Cos Cob
Cos Cob has had a total of $27.9 million in sales volume from 17 houses, up 4 sales from last year. The average sold price is $1.64 million, up 13% from last year. The average house size is just under 3,000 s.f. It is a very tight market with 3.7 months of supply, down just a little from last year.
Glenville
The Glenville district is kind of ground zero for the changing market. Sales are down from 41 sales last year to only 31 sales this year. It still has more sales than in Old Greenwich, Riverside and Cos Cob, but the total dollar volume of sales is down $20.8 million, but is still a strong market with $96.9 million of total sales.
Most of the rest of the country has seen more inventory, and in some of the formerly hottest markets, falling prices. This is not the case in Fairfield County which has recently been ranked one of the 10 hottest markets in the country.
My fellow team member, Dena Zara, just sold an immaculately prepared house in Glenville for over list with 5 offers. Months of supply is well under the 6 month dividing line between a buyers’ and a sellers’ market at 4.1 months of supply, but this is up 1.7 months from an even hotter 2023 Glenville market.
New Lebanon
The southeast corner of town has seen 12 sales this year, up 3 from last year. The average price is $1.9 million, which is up 66% from last year. The average sales price/sf, however, is up a much more normal 7% this year.
Julian Curtiss
Julian Curtis is arguably, our most diverse district from a real estate viewpoint. It includes central Greenwich, Belle Have and Chickahominy. We have had 25 sales this year, up 4 from last year with 4.8 months of supply. The inventory is up from 11 last year to 17 this year. More inventory led to more sales and the two perfectly balanced each other out, when calculating the months of supply.
Parkway
The Parkway district, which covers all of backcountry and much of the two-acre zone in mid-country has our highest months of supply with 6.1 months or what most people would consider a balanced market. Having said that it has our second most sales for the year with 52 sales. It also has more than twice the sales volume of Old Greenwich or Riverside. Parkway also has the highest average sales price of any area of town at $4.4 million. This is down 2% from last year, but the average sales price/sf is up 9%. It’s a very busy market.
That’s the snapshot for districts in Greenwich. Mortgage rates have come down and will come down more if the Fed makes a 50 basis point cut, which they should do. Just as it took a long time for their rapid rate hikes to have an impact on inflation, it also takes long time for a rate cut to fully work its way through economy.
Overall, we only have 3.8 months of supply, so cross your fingers that a lot of people want to put their house on the market in this fall market.
Mark Pruner, along with his brother Russ Pruner, are the founders of the Greenwich Streets Team at Compass Real Estate. He can be reached at 203-817-2871 or mark.pruner@compass.com.