By Mark Pruner
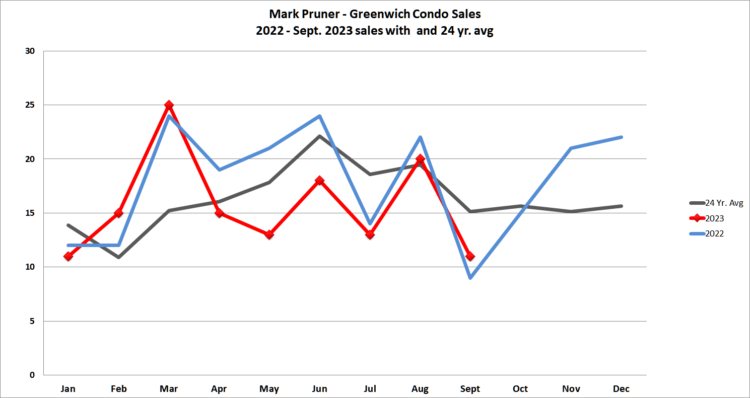
Condo sales in Greenwich stand out as distinct from other types of real estate transactions. Traditionally, house sales peak in June or July, and this monthly sales pattern remains consistent from year to year. Rentals, on the other hand, peak from May to July and exhibit a reasonably steady monthly sales pattern. Condominium sales deviate from the norm. This year, condo sales reached their peak in March, mirroring the same trend from the previous year. In prior years condo sales have peaked in September and even December.
This erratic monthly sales pattern can be attributed in part to the law of small numbers. Compared to house sales and rentals, Greenwich has many fewer condo sales. Over the past 24 years, the average annual condo sales in Greenwich have been 196, with annual sales fluctuating between a low of 91 sales in 2009 during the recession and a high of 265 sales in the booming year of 2021. Condo sales don’t just jump around in boom and bust years. In 2011, there were only 112 sales, and in 2005, there were 262. To establish a smoother monthly sales curve, one must consider a 24-year average. The small number of sales each month leads to significant month-to-month fluctuations.
BTW: All numbers in this article include co-op sales as part of the condo totals. Our 141 “condo” sales includes 18 co-op sales so far this year.)
You might be wondering why this lack of seasonality in condo sales matters. It’s important if you are a condo owner contemplating selling or if you are in the market to purchase one. In reality, every month can be a good or bad month for condo sales, and this uncertainty means you can’t predict the ideal month to either buy or sell.
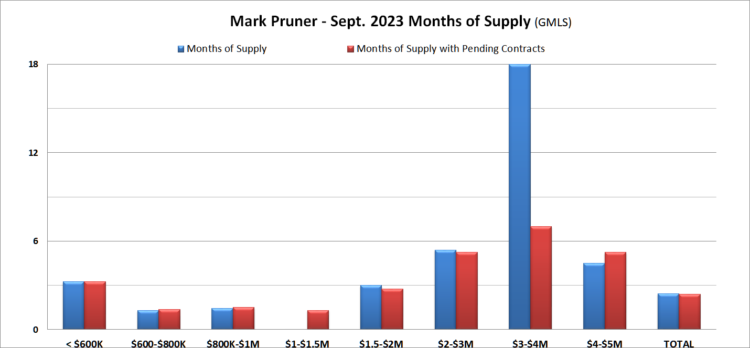
We have a spring market, because that when the largest number of homeowners decide to sell their house. Picking one season when there’s plenty of inventory doesn’t apply to the seasonality-less Greenwich condo market. At the start of 2023, there were 41 condo listings, which reduced to 38 in May and remained the same 38 condo listing in September.
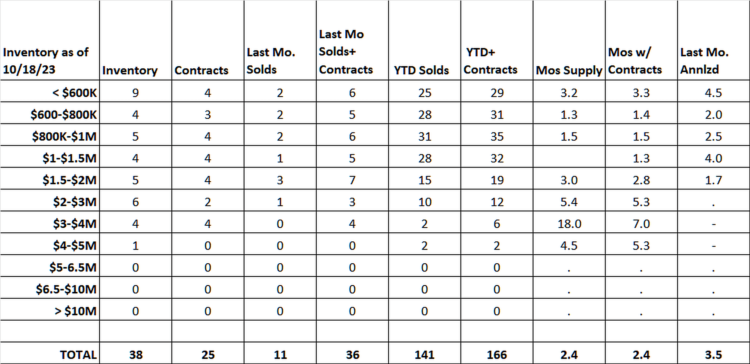
Since seasonability isn’t a good guide for buyers what is? If you’re a buyer looking for a bargain, pay close attention to the days on the market for each specific condo. Listings with significantly above-average months of supply are typically overpriced, have some significant issues (like being located near a highway), or require extensive renovations. Reducing the price can address all three issues, even if it results in a lower price per square foot compared to the competition. It’s surprising how often a seller with high DOM, will accept a reasonable offer, just don’t start out with low-ball bid or you are likely not to get a counter.
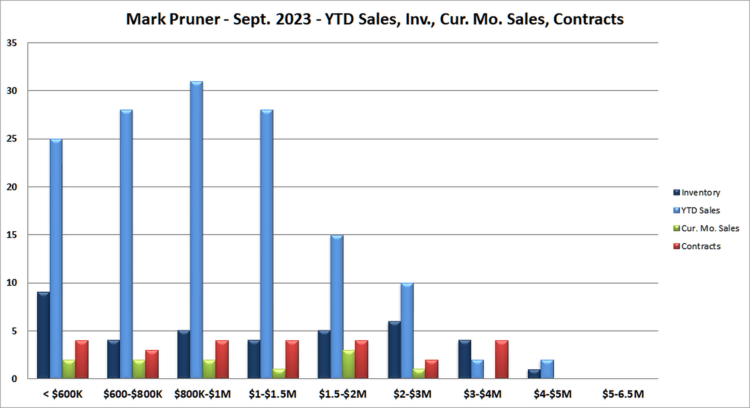
Over the past three years, the condo market in Greenwich has experienced a surge in sales. Sales have increased from 159 in 2019 to an all-time high of 265 in 2021. Up to September of this year, there have been 141 sales, which, when annualized, would be 188 sales for the year, slightly below the 196-average condo sales over the last 24 years. Given our low inventory, that’s still a pretty impressive number.
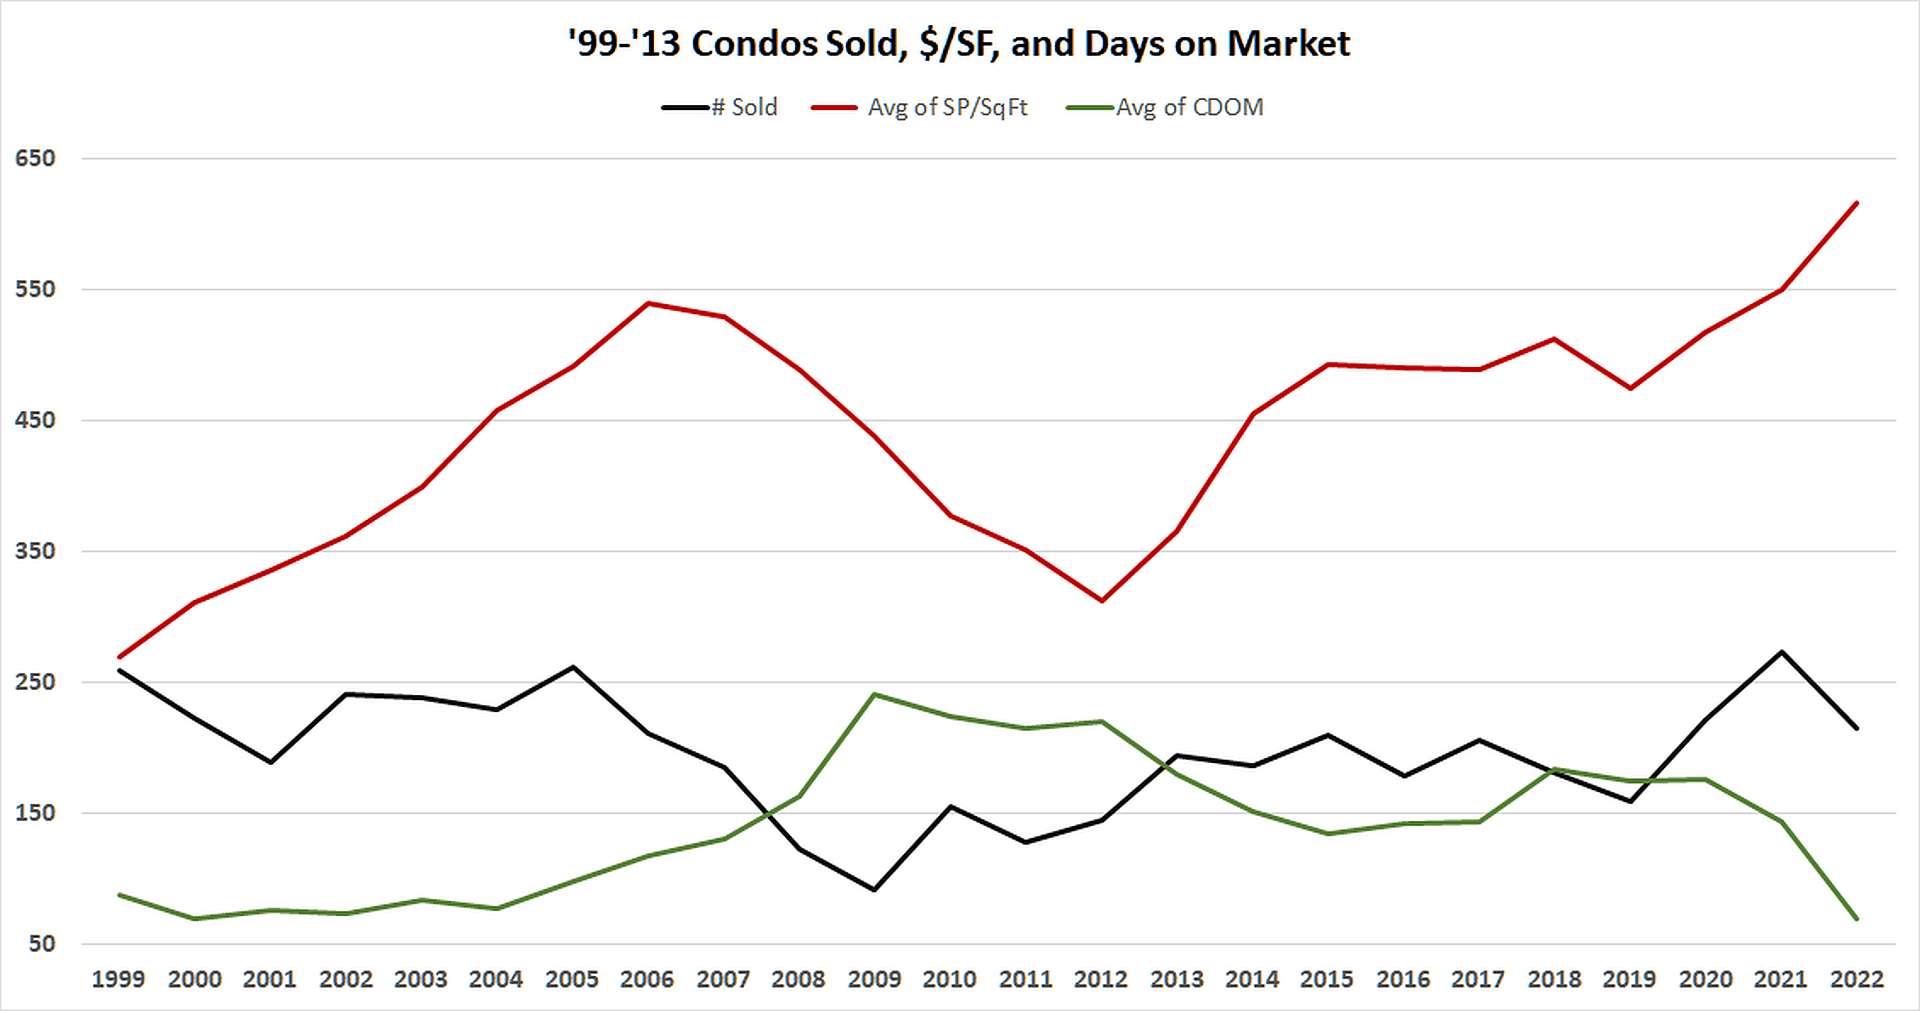
While slightly below average condo sales for 2023 may not sound exceptional, other market indicators are more promising. The price per square foot increased from $475/sf in 2019 to $616/sf in 2022, a 29.7% increase in three years. This year, the price per square foot is even higher at $692/sf, a 12% increase from the previous year.
In terms of days on the market, there has been a significant drop from 2019 to this year. In 2019, condos typically took about 176 days to sell. This number remained unchanged in 2020. However, by 2022, the days on market dropped to 144 days. In May of this year, with only 38 condo listings on the market, condos were on the market for an average of 66 days, the lowest ever.
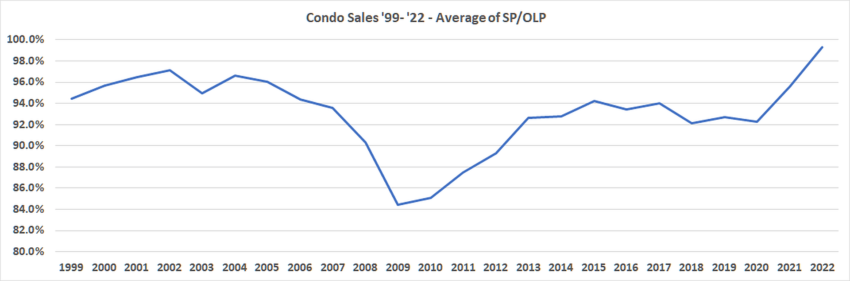
The sales price to original list price ratio has also shown an upward trend. It averaged around 93% from 2013 to 2020, but in 2021, it increased to 95.6% and reached almost full list price in 2022 at 99.3%. Although this year’s ratio dropped slightly to 98.4%, it’s still the second-highest SP/OLP ratio ever recorded.
In 2018, there were 36 condos listed over $2 million, while now, there are only 11 condos in the same price range, despite significant appreciation in the last five years.
This recent surge in sales, particularly in the high-end segment, pushed the total condo and co-op sales volume to $288 million in 2021. In 2022, it dropped to $237 million, also the second-highest on record, given the low inventory, that’s a lot dollars spent on Greenwich condos. So far this year, there have been $163 million in condo sales, which annualized would be $217 million. If these trends continue, this year will mark the third-highest total condo sales volume.
Condos offer an excellent housing option for those seeking to live in Greenwich at more affordable prices.
Mark Pruner is a Realtor with Compass. He can be reached at 203-817-2871 or mark.pruner@compass.com