By Mark Pruner
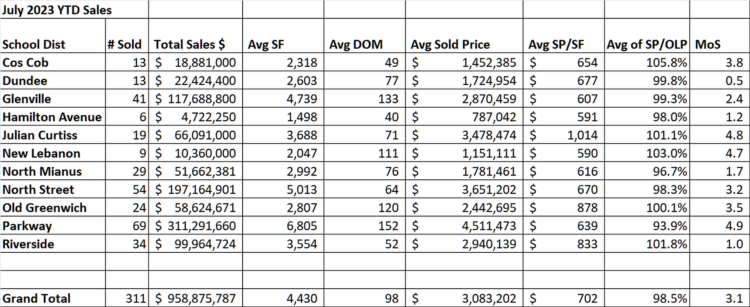
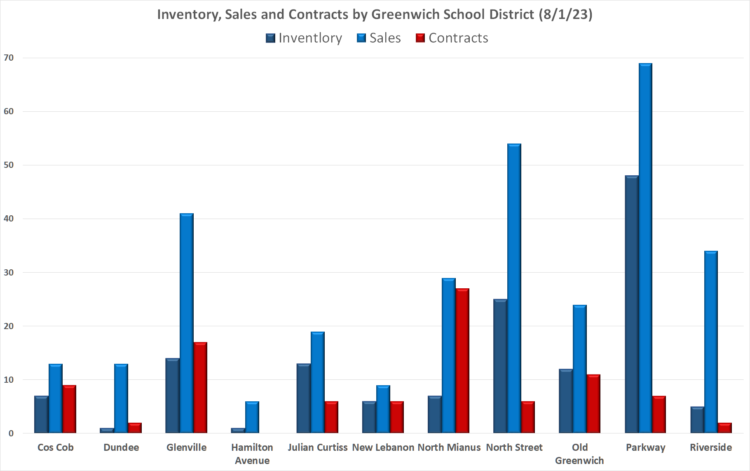
Since the end of April this year, we have sold 186 single family homes, but those sales are not evenly distributed by area of town. We have seen 69 sales in the Parkway district, while we’ve only had 6 sales in the Hamilton Avenue district. So, backcountry is hot, and Chickahominy is not doing well. Mathematically, that is true, but you need to look behind the numbers to see why there is a 1,100% difference in sales between the Parkway School District and the Hamilton School district? (For a quick comment on using our 11 elementary school districts for analysis see below*.)
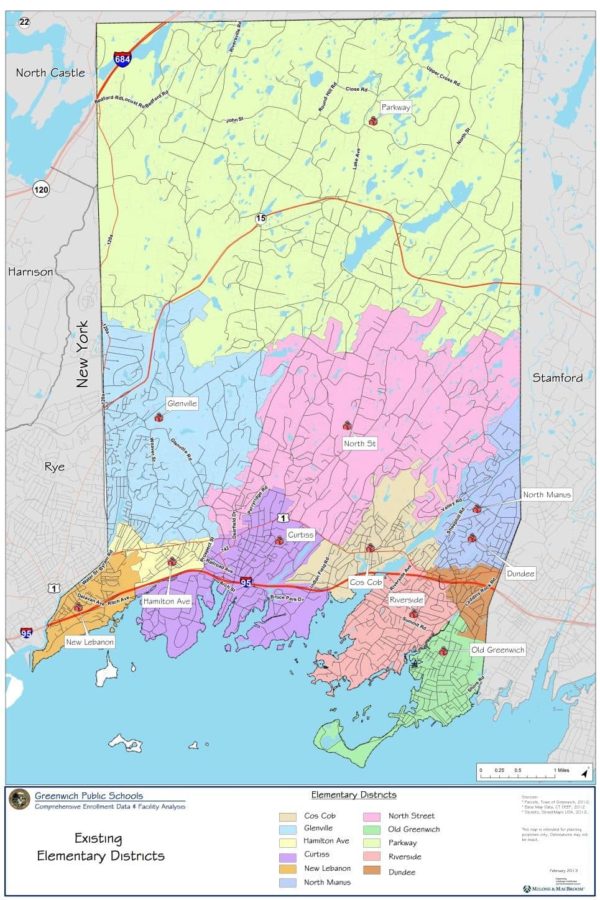
While the Parkway district’s 69 sales lead the town, If you look at the map of school districts, your response is likely to be, of course it does, it is the biggest district by. It takes up all of backcountry and much of the 2-acre zone below the Merritt Parkway. That size however is deceptive as larger 2 and 4-acre lots mean that the density of backcountry is about 5% of the density of the houses in the Hamilton Avenue district.
If it’s not a lot more houses in the Parkway district, then what is leading to the jump in sales in backcountry – one word INVENTORY. Parkway has houses to sell, Ham Ave, not so much. As of the end July, we have 48 houses listing in the Parkway district, while we only have 1 house on the market in the Hamilton Avenue district. In addition, the inventory of 48 houses in backcountry is actually up from April of this year, when we had 43 houses in inventory in backcountry. As a result, we have 69 sales in backcountry YTD, while we only have 6 sales in the Hamilton Avenue district.
The next conclusion you might come to is that the Parkway district is hot, and it is, but it’s the “slowest” district in Greenwich. The Parkway district is doing much better than it was pre-Covid with lots more sales due to much greater buyer demand for larger lots, larger houses and on-site amenities, things that were just considered more expenses after the Great Recession. Parkway district’s months of supply is down to 4.9 months of supply, when many people consider 6 months of supply to be a balanced market, which is remarkable as pre-Covid this district MoS were measured in years, not months
Unfortunately, there is nothing balanced about our market. The Parkway districts 4.9 months of supply is the most in any Greenwich district. Townwide, we are looking at 3.1 months of supply, which is a super seller’s market. In the Parkway district, we are looking at 2 more months of supply. In addition, the Parkway district has the days on market at 152 DOM and the lowest sales price to original list price at 94%. By comparison, Cos Cob, New Lebanon, Riverside, Julian Curtiss and Old Greenwich are all seeing houses sell for more than 100% of the original list price.
Hamilton Avenue District
So, why aren’t houses selling in the Hamilton Avenue district? We have only had 6 house sales in 7 months. There is that aforementioned 1 house in inventory, which is clearly keeping sales down. The result is 1.2 months of supply which leaves many folks that would love to live in a house in Chickahominy out of luck.
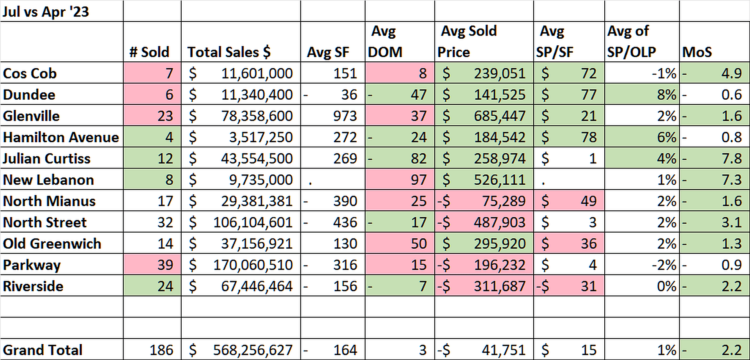
The problem is that not only don’t we have a lot of houses on the market in Chickahominy, we don’t have a lot of houses in Chickahominy. Much of Chickahominy is in an R-6 zone where two-family homes are allowed and we also have a lot of condos in the Hamilton Avenue district. Neither of these are counted towards the above numbers which are only single-family homes. Low sales don’t mean a slow market. Even with only 4 more sales than we had in April, that’s twice as many Hamilton Avenue district sales in the second quarter as we had in the first quarter. (BTW: Don’t go looking for that house in the Hamilton District, it’s now under contract. You do have a choice of 3 condos and 1 duplex.) People love this area. They move in and stay.
Old Greenwich vs. Riverside
Riverside is killing Old Greenwich this year with 34 sales compared to only 24 sales in Old Greenwich. Riverside houses are going to contract in only 52 days compared to 120 days in Old Greenwich. Riverside houses are going for 1.8% over list price, while Old Greenwich house are going for just 0.1% over list or 180% more over list. Since April only 14 houses have sold in Old Greenwich, while sales in Riverside are 71% higher in the second quarter than in the first quarter. [Riverside people should stop reading here.]
Once again, the reason that Old Greenwich does so poorly is a lack of things to sell. The average price/sf in Old Greenwich is $878/sf compared to Riverside’s $833. Old Greenwich has also seen the average price of a house increase from $2.15 million to $2.44 million since April, while the average price is actually down in Riverside by $312K from April. (Both of these averages depend more on the mix of what is selling than a clear price increase or decrease.)
Riverside homeowners can take “comfort” in that while both neighborhoods are supplied constrained at the moment; Riverside is even more supply constrained with only 5 houses to sell compared with Old Greenwich’s 12 houses on the market. Riverside has only 2 houses on the market under $3 million and nothing on the market under $2.5 million. In Old Greenwich, you have a choice of 12 houses with 3 houses under $2.5 million. Now’s the time to jump in as we see a spurt in OG inventory.
Cos Cob vs Glenville
As prices kept going up in Old Greenwich and Riverside, I’ve been showing my value buyers more houses in Cos Cob and Glenville. In 2023, these two neighborhoods have been a tale of two cities. In Cos Cob we have only had 13 sales so far this year, while in Glenville we have had 41 sales with 23 sales in the second quarters.
Once again this is Parkway vs Hamilton Avenue. Right now, Glenville has 14 listings while Cos Cob only has 7 listings. Glenville had 20 listings in February and 18 in April, so more houses have come on to replace those that have sold. In Cos Cob, we opened the year with 6 listings in Cos Cob, we go briefly to 13 listings only to drop back to 7 listings. Folks love Cos Cob, but some of them are going to have to move out, before we are going to sales go up there.
Summary
We are seeing the most sales in the neighborhoods where we have the most inventory. Even in those neighborhoods, there is not a lot of inventory. This lack of inventory has disguised a drop in demand due to economic uncertainty and higher interest rates, which most affects our sales under $2.5 million, our median sales price. The higher priced half of the market is tied to how the stock market is doing and lately, it’s been doing better. Bottomline, this may be a good time to list a house rather than waiting for the Fall market after Labor Day.
Stay tuned, the rest of the year is going to be interesting…
*Note on school district analysis
To be clear, while I’m using elementary school districts as my analysis areas, this does not mean that a particular elementary school is the determining factor for value or even a significant factor. In all the districts, the number of households with elementary age school children going to public elementary schools is a minority of the households in that district. The school district’s boundaries do make for useful lines, but to de-emphasize the tie to schools I’ll just refer to them as “districts”.
Mark Pruner is a Realtor with Compass. He can be reached at 203-817-2871 or mark.pruner@compass.com