By Mark Pruner
This year by the end of September, we have sold 75 houses between $5 and 10 million. This compares to 101 sales through the same time last year or a drop of 25%.
Over $10 million we have 8 sales which is down only one sale from last year. The problem at the ultra-high end is that 3 of last year’s sales were truly spectacular, even by Greenwich standards, with sales for $50M, $45M and $27.5M. So far this year our highest sale has been $17.6M. This comparison is a little unfair since last year our highest sale for $50 million occurred on December 1st, so we still have time to catch up, but we better hurry as we only have one house under contract and that is listed for $10.2 million dollars.
If you look at the entire year by annualizing our 2022 sales so far you come with a projected 112 sales for the year and a total dollar amount of $783 million compared to total sales of 135 sales last year and $1.069 billion dollars. That sounds pretty horrible, a drop of 23 sales and $287 million or over a quarter billion dollars in lost sales volume at the high-end.
These projected 2022 numbers are not horrible, in fact they are excellent. Go back two years and in 2020, we only had 81 sales over $5 million. For an even better comparison, if you go back to the most recent pre-Covid year of 2019, we only had 41 sales over $5 million. with sales volume of only $316 million. So, this year we are projected to have $467 million more sales volume than we had in 2019. In fact, go back as far as we have data to 1999, only one year had 100 sales and that was the pre-recession, boom year of 2007. It’s likely that 2022 will the be second best year that the high-end has ever seen.
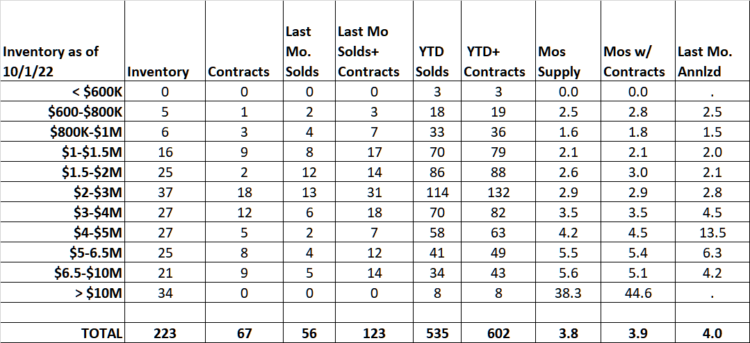
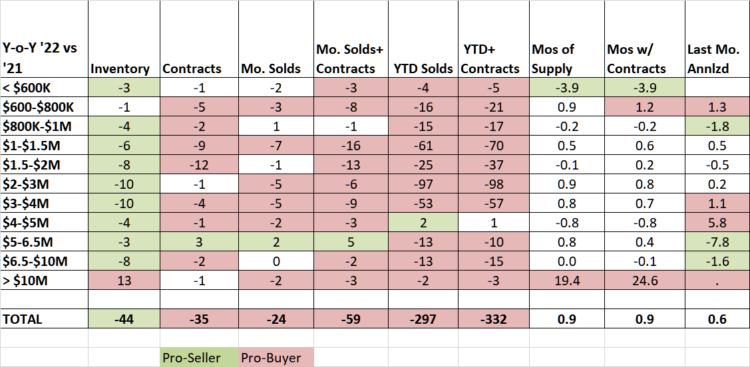
Our sales stay strong all the way up to $10 million. From $5-6.5 million we have had 41 sales and from $6.5 – $10 million we have had 34 sales. (I divide the price range at $6.5 million since that is roughly the price where inventory is equally divided.)
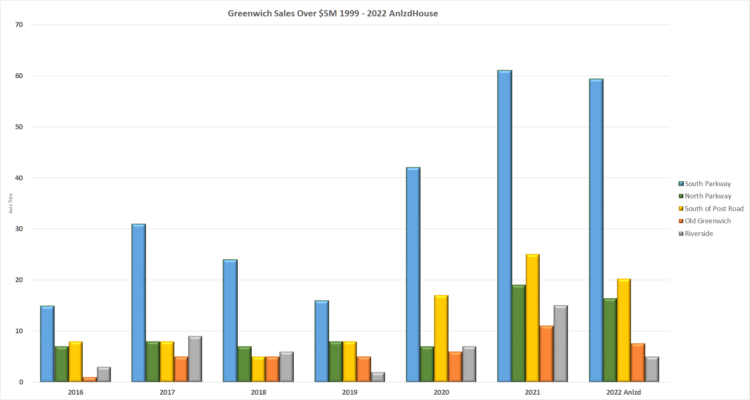
When you look at where these sales are you see that they are in backcountry, mid-country and along the water in Belle Haven, Mead Point, Riverside and Old Greenwich. As you might expect inventory is concentrated in the same areas, mid-country is where we are seeing noticeably more inventory than sales. Our four-acre zone has the potential for much larger houses in backcountry, which is very attractive to the high-end luxury market. Along the water, you’ve got Long Island views, so the lots seem much bigger, at least if you only look Soundward.
If you look at high-end sales by neighborhood, you’ll notice that the law of small numbers kicks in and we see these number jump around from year to year. What you also see however is that 2017 was a good year for high-end sales, with 61 total sales and then we saw drops in 2018 and 2019 as the changes in the Tax Cut and Jobs Act kicked in with 48 sales and 40 sales respectively. With Covid, sales went up in 2020 to 79 sales and to 131 sales in 2021.
As you will note, we only have 5 neighborhoods with sales over $5 million: backcountry, mid-country, South of the Post Road, Old Greenwich and Riverside. Since 1999, we also have seen high-end sales in Byram along Byram Shore Drive with 12 sales, 5 sales in Glenville and 1 sale in Cos Cob in the same period. (Now some people are going to protest that there are more and there are many more, but these are the sales that have been reported to the Greenwich MLS.)
When you look at the 2022 sales, they look very good in comparison to all the previous years, except when compared to last year’s record sales. That’s why year over year sales comparison this year are so deceptive. What is a big decline in this year from last year, actually makes 2022 our penultimate year historically for high-end sales.
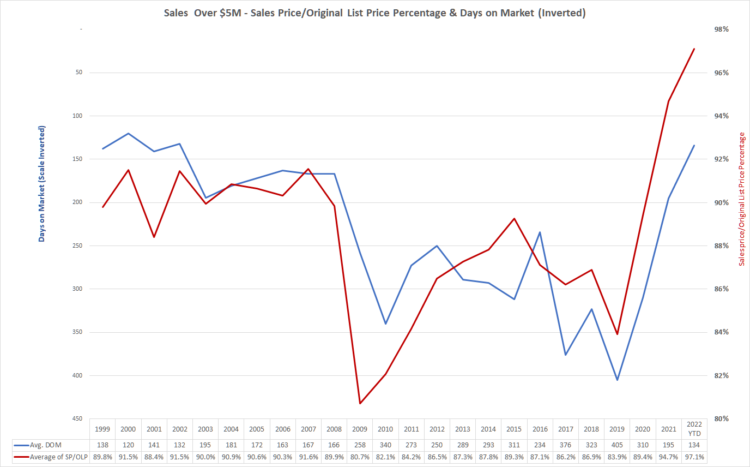
You could even argue that our high-end market is actually tighter than last year, when you look at days on market for sold properties and the sales price to original list price ratio. Last year our average for days on market was 195 days for properties that sold. This year that number has dropped to 134 days on market.
Last year, our high-end house sale price to original list price percentage was 94.7%, the highest percentage ever until this year. This year, high-end houses were selling for 97.1% of their original list price. A couple of points about this, however. These numbers are averages and we have 17 out of 79 houses in inventory that have been on the market for over a year. If one of these houses sell it will skew that percentage a lot.
The other thing to note is that these are the numbers for the houses that sold. If you look at the average days on market for the high-end house that have not sold, you come up with 257 days on market compared to the aforesaid 134 days on market for the houses that did sale. When you see this kind of difference, you can tell the houses that sell are priced much closer to market than those that don’t sell. We have a lot of aspirational pricing in the market.
Mark Pruner is a Realtor with Compass. He can be reached at 203-817-2871 or mark.pruner@compass.com