
By: Mark Pruner
The 2020 Year End Real Estate Report
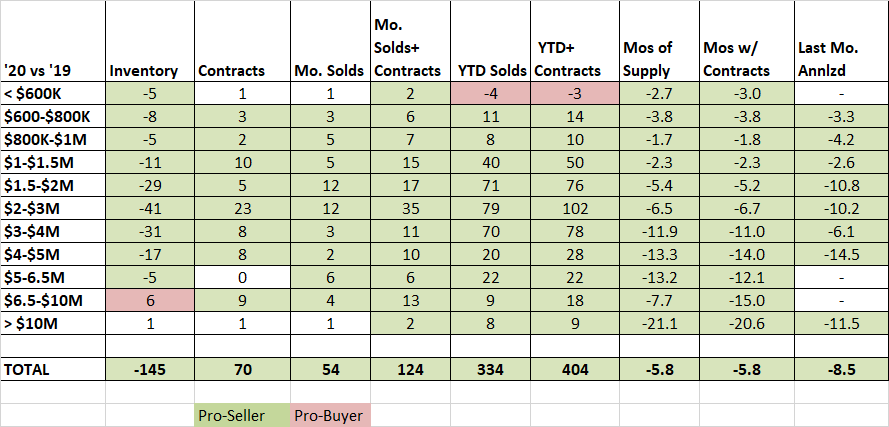
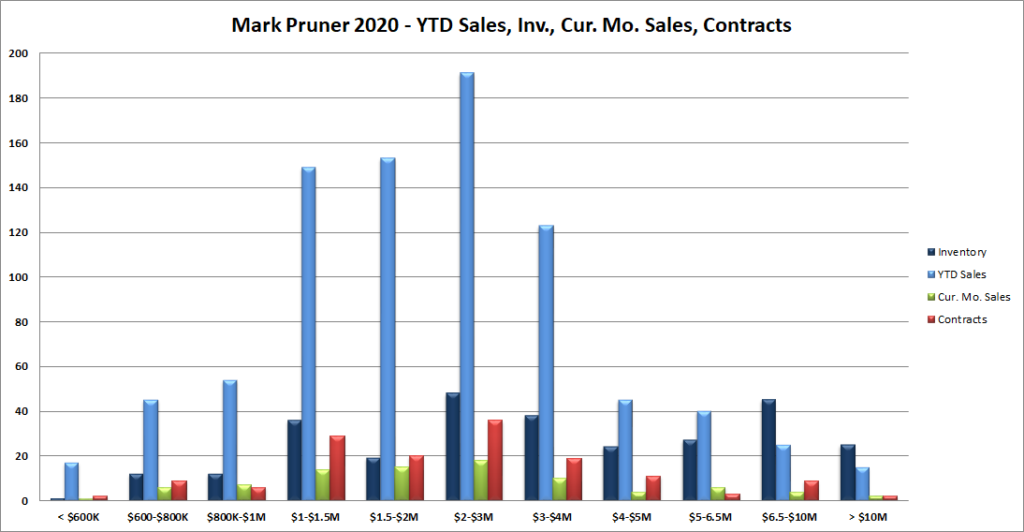
One thousand and three transactions, that’s what we did last year. These 1003 transactions consisted of 861 sales up 334 houses from 2019 or 63% and 142 contracts up 70 houses or almost a 100% increase. And, it wasn’t like these sales and contracts were concentrated in any particular price range. Literally, every price range, except our lowest price range was up. Even, the fact that sales under $600,000 were down, may indicate a stronger market as houses were priced out of our lowest price range and pushed over $600,000.
Our biggest winners this year compared to last are sales and contracts from $3 million all the way up to $40 million. In all 5 of these high-end price categories, transactions were up by over 100%. By numbers, we saw an increase of 155 more houses sold or under contract at our high-end. The biggest winner for the year was the $3 – 4 million price range where sales were up 132% from 53 sales last year to 123 sales this year.
In our highest price range, over $10 million, sales were up 114% from 7 to 15 this year. Now when you have 861 sales in a year, 15 sales may not sound like that much, but those 15 sales totaled $217,400,000. If you start with our least expensive sale and go up, you need 224 sales to total the $217 million represented by these 15 years. Our over $10 million market was actually better than that. These are the Greenwich MLS sales numbers, and they don’t include the $42 million sale on Indian Head Road in Riverside, nor does it yet include the John Street contract for Tommy Hilfiger’s house listed at $47,500,000. If you include just those two sales, you’d be looking at over $300,000,000 of ultra-high-end sales (assuming the John Street house gets close to list.)
$2.3 billion in total home sales
In total for 2020 sales, we had $2.3 billion in single family home sales in 2020. This is in one year, in a town of only 62,000 people. Back in 2019, our total sales volume was only $1.25 billion meaning our total volume was up 84%, most of which happened in the second half of the year.
What is really remarkable is that 2020’s $2.3 billion in public sales exceeds our previous record for sales which was set 16 years ago in 2004. That year we sold 978 houses for a total of $2.17 billion dollars, and that number includes both public and private sales.
A remarkable 2nd Half and 4th quarter
The 4th quarter saw sales increase by 143% over the 4th quarter of 2019. Total sales volume increased even more from $251 million in sales in the 4th quarter of 2019 to $804 million in sales or an increase of 221%. Even in this remarkable year, our 4th quarter was head and shoulders above the prior quarters for percent increase, which bodes well for the first quarter of 2021.
Quarterly Sales Numbers
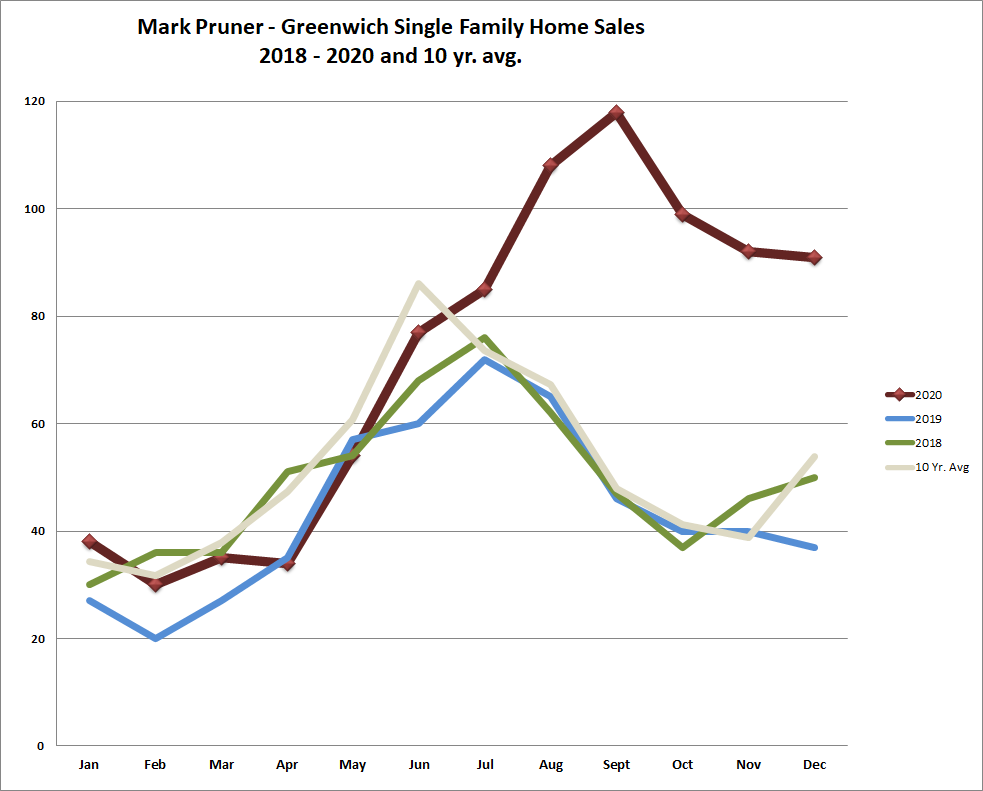
While the first quarter was better than 2019, it was much like our 10-year average. In the second quarter, when Covid had its greatest negative impact, April was slow as we went into lockdown followed by a better May and June as we saw the beginning of an exodus of families from New York City. Our second quarter while better than the poor Q2 2019 was still a little below our 10-year Q2 average. Then came the third quarter and sales took off. July was better than average and August and September were our highest months of the year.
What was amazing about the 4th quarter was that sales just stayed high. Normally the 4th quarter has about 21% of our sales as things slow down for the holidays; that’s not what happened in 2020. We got 3 consecutive months of sales numbers in the 90’s. The 4th quarter of 2020 represented 35% of sales. The 4th quarter sales numbers were 282 house sales, up 166 houses from 2019 or 143%, and up 147 sales from our 10-year average.
High-End Sales in 2020
We saw a big jump in the average sales price from $2.14 million in the 1st quarter to $2.85 million in the 4th quarter or a 33% price increase. This price increase was driven by the increase in the high-end sales in Greenwich that started in June. The June increase was expected as many sellers wanted to avoid the Gold Coast tax; the 1% increase in the state conveyance tax for sales over $2.5 million that kicked in on July 1st. What was surprising was the continuing increase in high-end thereafter. While these high-end sales increase are certainly encouraged by Covid; it also seems to be tied to higher levels of violence and shootings in New York City.
Average Greenwich sales price up 12.4% in 2020
In 2020, our average sales price was $2.67 million up 12.4% from our 2019 average sales price of $2.38 million. The median sales price was $2.08 million up 11.4% from 2019’s $1.87 million median. Our average sales price peaked at $2.97 million in 2007. We still have a way to go get back to our 2007 peak, but we are getting there with double digit appreciation. (BTW: All this historical data is from my brother Russ, who has a great website with historical data at russellpruner.com.)
Now, as I constantly write, most of the change in both the average and the median sales price is not due to a general appreciation of all houses, but a change in the mix of what is selling. If you double the number of sales over $3 million you will get a big jump in our median and average sales price.
A better way to get a feel of how your house value is doing is to look at the changes in the sales price/s.f. and the sales price to the assessment ratio. Our sales price per square foot is up 4.1% over 2019. Our sales price to the tax assessor’s assessment is up 3.1% over last year’s SP/Assmt ratio. So, by this measure, house values are up 3 – 4% in Greenwich for 2020, but if you are talking to someone from Darien you can let them know our average price is up 12.4%.
Inventory and Months of Supply Way Down
The one stat that probably should get more attention right now is inventory, because it is at record lows. Our 287 house listings are down 145 listings from last year or a drop of 34%. For the last several months our inventory has been down about 25% from last year, but it held steady at that level, meaning that new listings were coming on about as fast as they were going off.
In December, as usually happens during the holidays, new listings slowed down, while sales stayed high with 91 sales compared to a 10-year average of 54 December sales. The result was both inventory and contracts shrank. At the beginning of December, we had 378 listings and 171 contracts, by January 1st we were down to 287 listings and 142 contracts. The drop in inventory was not solely due to sales, we had 17 listings expire unsold at year end on December 31st. Regardless of the cause, 287 home listings is a historic low for inventory.
If you compare the months of supply at the beginning of 2020 with months of supply at the beginning of 2021, the difference is startling. Last year from $4 – 5 million we had 26 months of supply. This year we have 3.7 months of supply. That dramatic drop is true across all price ranges. For the entire market we went from 9.8 months of supply at the beginning of 2020 to only 4.0 months supply at the beginning of 2021.
We Need a Lot More Inventory
I was hoping that a lot of sellers were waiting for the new year to put their house on the market, but that is not what we are seeing so far. In the first few days of 2021 we have seen only a handful of new listings. This lack of inventory is the biggest present threat to 2021 being a good sales year.
If you are thinking of selling your house call me or take advantage of the fact that everyone in Greenwich has zero degrees of separation from a Realtor. With over 1,100 dues paying GMLS members, you probably have a neighbor, a tennis buddy, a club member, a carpool friend or a fellow school parent that is an agent. Call me, call them, please do it this weekend.
The ideal time to put a listing on the market is when supply is low, and demand is high. This is exactly what we have now.
What Will Happen to Greenwich Real Estate in 2021?
How will this year play out? The one thing you can be sure of is that no one knows. Covid cases are reaching record highs across the U.S., but Connecticut has been one of the most successfully states in getting people vaccinated. We have a hot market, but low inventory. It is a great time to list your property, but January is not known for a lot of listings.
In 2020 we had lots of people who had been waiting for years to list their properties for sale, do we still have that number of people or has our shadow inventory mostly disappeared? Prices in New York City are dropping, and people are getting the vaccines, will the NYC real estate market return to normal? Federal relief bills are authorizing record amounts to stimulate the economy, leading to record amounts of debt, what happens when interest rates tick up? I could go on and on with countervailing factors, but there is no way of knowing which factor will outweigh their countervailing factor.
Stay tuned, it’s going to be a really interesting first quarter.