By Mark Pruner
Dashboard Editor
 We had 55 house sales in May 2015, which will probably match our 10 year average of 61 May sales once the private sales are included. The big story is the other end of the sales process; the 696 single family homes we have in inventory.
Last year at the end of May we had 574 home listing or 122 listing fewer. We also had 21 more contracts making for much more of a seller’s market. The increase in inventory is spread throughout the price ranges from lowest price houses all the way up to $10 million. The drop in contracts while not as dramatic as the increased inventory is also spread throughout the price ranges though not as evenly.
We do have two price ranges that are more pro-seller than they were last year. Sales from $800K – $1M are up from 11 to 14 sales and contracts are also up 3 compared to May 2015. The segment that really stands out from last year is $2 – 3 million where contracts are up 13 over last year and we sold 5 more houses this year over last year.
Our median sales price is down a little due to weakness in the high end, which really stands out since our average listing price is $4.4 million.
Our year to date sales are actually 2 houses more than last year due to an excellent February, which probably resulted in the poor March sales. April and May sales have been consistent with our historical sales average. What’s surprising is that, while we have more inventory, much of our increased inventory is in only a couple of price ranges; $1 – 2 million and $5 – 10 million. (NB: In 2015 I used a price range of $5-7 million, but switched to $5- 6.5 million this year since it more evenly divides the $5-10 million segment so we do have more inventory this year.)
Our sales are the same overall YTD compared to last year. We do see a couple of price ranges that are up or down, but it’s mostly just chatter. The increase in inventory has taken what is a normal sales year and made it more of buyer’s market as this same rate of sales as last year is not absorbing inventory as fast as it is coming on.
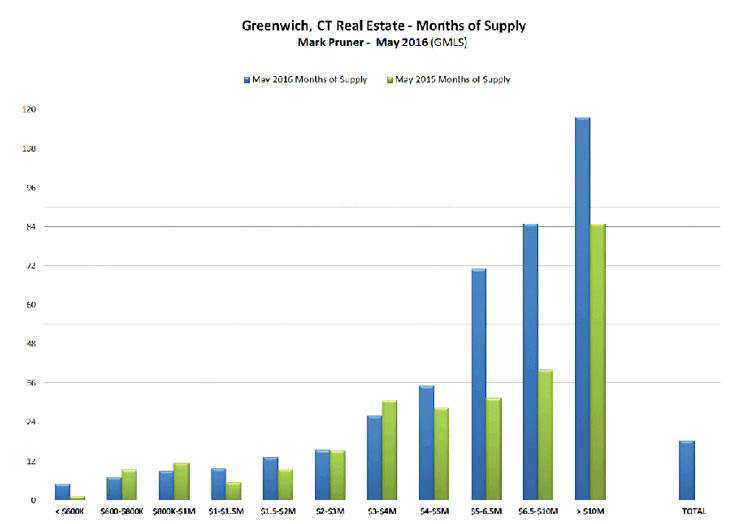
The increase of inventory between $5 and $10 million really jumps out when you look at the months of supply. From $5 – 6.5 million we have about 6 years of supply and 7 years of supply from $6.5 to 10 million compared 2.5 year and 3.3 years of supply in 2015.
Our months of supply from $1 – 1.5 million and from $1.5 – 2.0 million are both up about 4 months to 9.6 months and 13.2 months of supply. Both of these will be coming down as we have 40 contracts between $1 and 2 million waiting to close.
When you look at the pie charts the $2 – 3 million sales and contracts really stand out while the high end sales and contracts are slow. Now we have seen this the last couple of years as Wall Street doesn’t give out the big cash bonuses the way they used to do. The third quarter is when high end sales are most likely to happen.
One thing that has changed from 2015 to 2016 is where the sales are happening. Old Greenwich and Riverside, south of the Post Road, continue to do well. Cos Cob is where it is happening with lots of sales on the east side of town. The western border is also doing well as Glenville and the new and improved Glenville Elementary has gotten hot. Backcountry didn’t do well in May, but it has had 18 sales so far this year and another 13 contracts.
Right now we continue to see inventory come on and the question is will sales accelerate above our average to catch up. It’s a good time to be a buyer.
MARK PRUNER
DOUGLAS ELLIMAN REAL ESTATE
DIRECT: 203.969.7900
OFFICE: 203.622.4900
MOBILE: 203.969.7900
mark.pruner@elliman.com
88 FIELD POINT RD, GREENWICH, CT 06830