By Mark Pruner
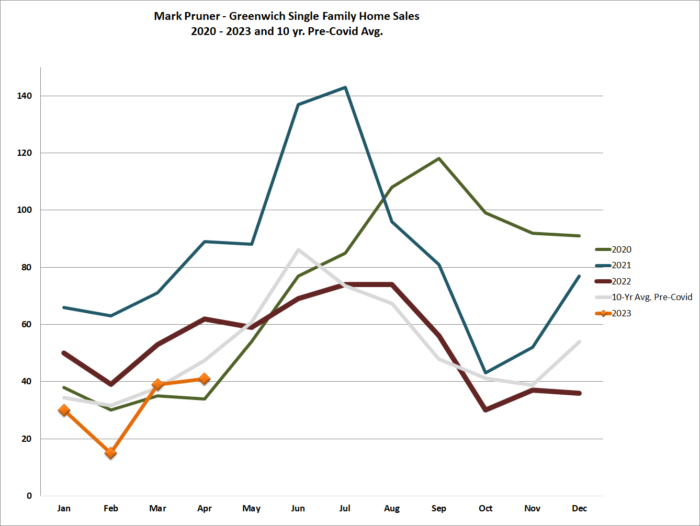
The last two months have certainly been better than the first two months of the year. Our January and February sales were well below average with only 45 single family home sales compared to a 10-year, pre-Covid average of 66 sales. In March and April, we had 80 sales, or 35 more sales than we had in the first two months. Now, these 80 sales for March and April were still slightly below our 10-year average for these months of 85 sales, but much better, after what had been a scary start to the year.
For the Greenwich economy, this means more conveyance tax for the town, more jobs for moving companies, attorneys and banks, more work for contractors as improvements are made, more furniture sales, and a variety of other dollars that go into the local economy associated with hundreds of millions of dollars in real estate sales. Total sales volume for single family home sales grew by $251 million from $140 million in the first two months to $391 million for the first four months of the year. Overall, we were up 180% in March and April sales dollars over January and February.
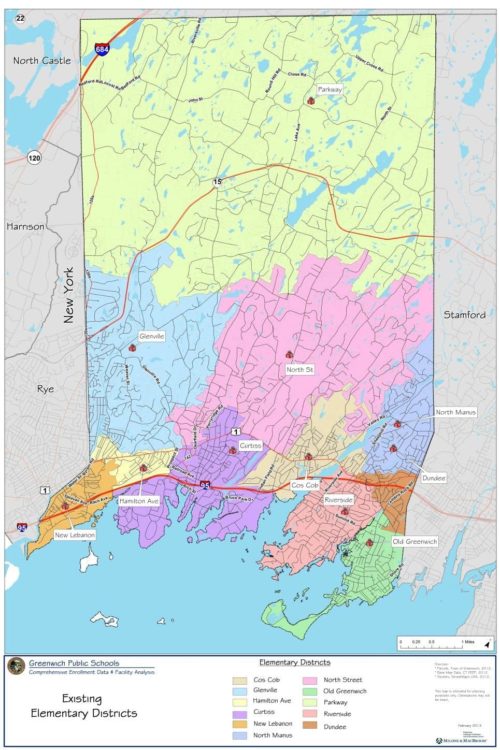
These sales were not, however, evenly distributed around town, nor was their a consistent increase when you look at sales by school districts. Analysis by school districts makes for an easier neighborhood comparison than the town areas that the Greenwich MLS uses, where a huge portion of our sales are in one mega-block called South of the Parkway. This GMLS district covers everything from Clapboard Ridge to Maher Ave. It’s also better than RTM districts.
To be clear, while I’m using elementary school districts as my areas, this does not mean that a particular elementary school is the determining factor for value or even a significant factor. In all the districts, the number of households with elementary age school children going to public elementary schools is a minority of the households in that district. So, while we have many excellent public elementary schools, they are not the main determining factor in real estate values in the districts. The school district’s boundaries do make for useful lines, but to de-emphasize the tie to schools I’ll just refer to them as “districts”.
Parkway school , which covers all of backcountry and most of the two-acre zone, is our largest district and has had the most sales this year. We have had 30 sales there, which is up from 12 sales in the first two months. Now you would think, largest area and largest sales numbers go together, but that is deceptive. North of the Merritt Parkway is our 4-acre zone and south of the Merritt is our 2-acre zone, so even though this district appears large, Parkway district actually has a smaller number of house lots than do some other districts with smaller zoning.
When you look at contracts, Parkway district also does well, leading other districts with a total of 28 contracts waiting to close. That must mean that Parkway is our hottest district; doesn’t’ it? There you would be wrong. Yes, Covid has brought demand back to the backcountry and mid-country areas where we saw falling demand and falling prices for many of the post-recession years, but it’s also where we have the most inventory.
Parkway district has 43 houses for sales as of the end of April compared to 44 houses for sales as of the end of February, so inventory has been flat, meaning the 30 sales in the Parkway district are matching new listings as they come on the market. At the same time those 30 sales have taken an average of 137 days on market to get to contract. Compare this to the Riverside district where the average days on market is only 59 days.
The Riverside district is arguably our toughest, and most competitive, district to buy a home. We only had 10 sales in the Riverside district, but this is up from only 2 sales in the first two months. Lack of inventory is killing sales in the Riverside district. In February we had 8 choices to choose from and we had the same number in April. As a result, we saw the average house in Riverside sell for 102% of list price
For the town overall, inventory grew from a paltry 142 single family homes listed at the end of February to a tiny 167 listings at the end of April or up only in 15 listings in our spring market. We should have grown by 200 listings going from around 400 listings at the beginning of the year to 650 listings now. Townwide, we are severely restricted by the small number of new listings, but where we have inventory, we have sales.
Old Greenwich district is another example of supply constrained sales only a smidgen behind Riverside. In the Old Greenwich district, we went from 7 listings to 12 listings or a “huge” 71% increase in inventory, but it was only 5 houses. Contracts showed the same thing, going from 6 to 10 contracts, while sales doubled going from 5 sales in the first two months to 10 total sales in the next two months, i.e., we had 5 sales in January and February and 5 sales in March and April. We also are likely to see more than 5 sales in the Old Greenwich district over the next two months, but its small potatoes compared pre-Covid times or the extraordinary sales we saw in 2021.
For the biggest percentage increase in sales over the last two months, take a look at the North Street and North Mianus districts. Sales were up 500% in the North Mianus district and were up 450% in the North Street district. North Mianus went from 2 sales to 12 sales and North Street went from 4 sales to 22 sales. North Street district also has the second highest number of contracts waiting to close with 23 contracts, only beaten by the 28 contracts in the Parkway district.
Overall, in every district, with the possible exception of Parkway, it comes down to inventory. When you look at days on market and sales price to original list price ratio, these numbers are showing a tight market. Demand is down, but there is still plenty of demand for the small amount of inventory we have.
Riverside, Cos Cob and Old Greenwich districts are probably the toughest areas for a buyer to find the right house. In total, there are only 33 listings available to buy, when we should have well over 100. Not far behind are Glenville, North Mianus, North Street and Julian Curtis, with more demand than inventory.
With an ever-increasing chance of a recession, now is a good time to list a house. For buyers, waiting for lower prices in a possible recession. may not be a good strategy. While demand may drop as we go into a recession, we may also see interest rates drop, leading to more people being able to buy the house they want. At the same time, we would need to triple our present inventory to get back to anything like normal inventory level. For the near future, it continues to look like much more demand than we have supply. The needle may move towards the buyers’ market, but it’s got a long way to go.
Mark Pruner is a Realtor with Compass. He can be reached at 203-817-2871 or mark.pruner@compass.com