
By Mark Pruner
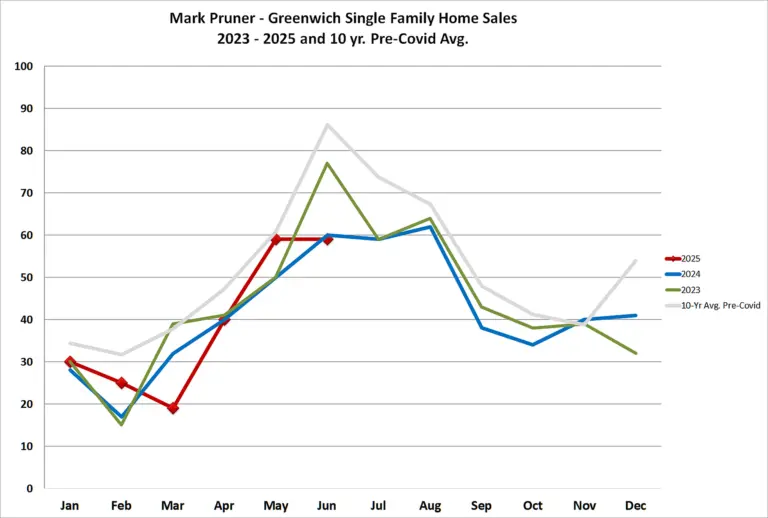
I’ve seen some market reports that compare this month’s sales to the prior month and on that basis Greenwich sales of single-family homes are on a long streak of improvement since February when we had 20 sales. Each of the following months saw sales climb steadily; March – 27 sales, April – 35 sales, May – 57 sales, June – 60 sales and in July we had 70 sales. We also have 95 contracts pending which is up 9 contracts from last year.
The problem with comparing this month’s sales to last months sales and trying to make any conclusions is that real estate sales have a pronounced seasonal element. The National Association of Realtors seasonally adjusts their numbers to try to take out the skew to higher summer sales and lower winter sales. The problem with this approach is that it misses systemic changes, which is what might be happening now.
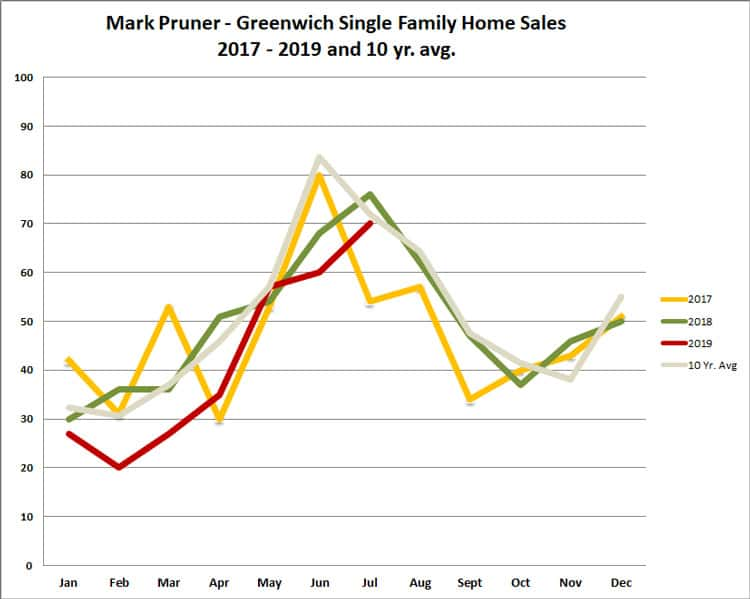
If you look at our 10-year average for sales, there is a strong peak in June with a 10-year average of 84 sales compared to May’s average of 57 sales and July’s average of 72 sales. This year we had 70 sales in July compared to 60 sales in June 2019. This pattern is a repeat of 2018 sales where we had 76 sales in July and only 68 sales in June 2018. Going back to 2006 we have had this happen only twice; once was the recession year of 2009 and the other was in 2014 when we had a big jump in sales the last few days of July.
So, we’ve now had two consecutive years with more July sales than we had in June. The question is, is this a new trend with sales happening later in the year? If so then June 2019 sales don’t look so bad. We also saw the same thing in 2018 with July contracts there up over July 2017 contracts. If this trend continues then some of the gloom and doom that pundits were focusing on in the first half may simply be a shift in sales to later in the year. (BTW: If you ever need to look at prior months statistics the Greenwich Sentinel has my articles posted at GreenwichSentinel.com until July of 2015 and I have another two years of monthly reports posted GreenwichStreets.com that have additional charts I use both of these resources several times a week to answer questions that clients and other agents have. They are free for anyone to use.)
The July increase in sales was also matched with a drop-in inventory to 640 house listing. Now this is down only three listings in total from July 2018’s 643 listings, but it means that we have worked off the bubble of inventory that we had for the prior months in 2019.
When you look just at the present state of the market today, things don’t look too bad. Our inventory is down to 615 listings our July sales were only 2 sales below our 10-year average and our contracts are up over last year. But we are still transitioning from a poor first half. For the year to date our 296 sales are down 55 sales or 16% from last year. Lower sales for the year so far have led to an increase in months of supply for the year. We are up 2.3 months of supply for 2019 to 15.1 months from 12.8 months of supply at the end of July last year. That is not a great number.
We do have some residual bad news hangover. Three price categories have both higher inventories and lower sales for both the month of July and year to date. The curious thing is that these price categories are spread throughout the price ranges and isolated from good price ranges around them. Whenever you have transition months, things look confused, but if you have a listing from $600K- 800K or from $1.5M – 2.0M or from $4M -5M. It is more of a buyer’s market than it was last year.
On the flip side, inventory is down noticeably from $880K – 1.5M and from $5 – 6.5M. These markets which had looked weaker this year are matching lower inventory and sales similar to last July.
Hidden in the sales numbers is a significant improvement in months of supply from $6.5M – 10M where we are down 37 months of supply from a bad 72 months of supply to 34 months of supply this year. Now a little under 3 years of supply is not great, but it’s a lot better than 6 years of supply in 2018.
The other area that stands out is the $2 – 3M where whose inventory is down to only 21% of the market but has 23% of sales YTD and 25% of the contracts. This should continue to look good in August due to the number of contracts.
So, that’s how the overall market is doing, how are the individual neighborhoods doing. The short answer is things have reversed from last year. Where last year Cos Cob, Riverside and Glenville were hot; this year not so much. So, the bad news first.
Cos Cob so far this year has seen the biggest reversal with sales down from 45 sales through July of last year to only 25 sales this year or a drop of 45%. Inventory is also up from 46 listings to 58 listings. Despite sales being down and inventory being up, the average days on market for sales is about the same as last year with 151 days this year compared to 161 last year.
As always, the people who price their listings competitively are ones that get sales. Homeowners will find that competitive prices this year are lower this year than last year. The sales price/sf, sales price divided by the town’s assessment and the sales price to original list price are all down compared to last year.
Riverside has seen a decline of 17 sales so far this year from 62 sales to 45 sales or a drop of 27%. Part of the reduced sales in Riverside is due to a substantially reduced inventory going from 92 listings last year to 68 listings this year, which is a drop of 26%, which almost exactly matches the drop in sales. As to prices Riverside is telling a mixed story as sales price/sf and the sales price to original list price are both down from last year, while the sales price to assessment ratio is up.
Glenville is a much smaller market, with only 21 listings and 12 sales so far this year, but the 12 sales is down from 21 sales last year. In Glenville, unlike Riverside the inventory is almost the same with 21 listings this year and 20 listings last year. As to the price change indicators, Glenville has the lowest sales price to original list price ratio. This means that houses are coming on higher in Glenville then the market thinks they are worth. Both Glenville and Cos Cob had seen more demand in the last couple of years as Old Greenwich and Riverside had gotten so expensive. It looks like, that bargain premium is down in 2019.
South of the Parkway has been a tougher market this year with sales down from 93 house sales last year to 82 this year. At the same time, inventory rose from 194 last year to 212 listings this year. All three price indicators are down though not a lot. Given that sales are down 16% for the town overall and sales in this area are only down 12%, you could argue that this area is actually doing better than average.
I have one of those 212 listings at 108 Pecksland and it is what I consider an amazing value with a list price of $1.65 million. This compares to the Tax Assessor’s FMV of $2.34 million. We are getting showings, mostly by families with school age children, but there is a real reluctance to take on even small renovation projects. If you are a buyer that doesn’t mind doing work on a purchase, you have some real bargains to pick from.
Now despite the fact that sales are down overall, we do have three areas with good news.
North of the Parkway
Deals have gotten so good North of the Parkway that sales are up for the year as is the average sold price per square foot, while inventory is essentially the same as last year. Now this isn’t a big turnaround, but it’s possible we saw the bottom for backcountry at the end of 2018.
Deals are still tough as can be seen from an original list price to sales price ratio of only 86%, but part of this is the large number of houses over $5M, where the traditional SP/OLP is more like 75%. Part is also some houses under $5M that started out too high a while ago have had to really chop their price to generate interest.
For folks in backcountry and mid-country two properties are generating lots of interest and concern. Aquarion Water Company announced that they are consider selling the 80 acres that they own on Lake Avenue just north of the Merritt Parkway. They had previously proposed developing this land in 2006. State law requires the water company to first offer the parcel to the town and then to open space organization and the whole process is likely to take a couple of years.
The other property, Mel Gibson’s old property between Old Mill Road and the Merritt Parkway is up for and Inland Wetlands and Watercourses hearing on Monday August 26th. The developer has proposed 28 houses on 75 acres in what is putatively the 4-acre zone.
Old Greenwich’s inventory is down 13 listings as of the end of July to 68 listings from 81 listings last year. As townwide sales got back to our 10-year average in July so did Old Greenwich, but in Old Greenwich’s case this was not a pickup in the sales rate, but a slowing. OG has sold 51 houses so far in 2019 compared to 52 houses in 2018. The three price change indicators have also turned flat to slightly down, but regardless the activity earlier in the year still gives OG a leg up over other areas of the town due to its good sales earlier in the year.
Byram
The other southern corner of Greenwich, this one in the southwest corner, is doing spectacularly well if you look at the percentage change from last year. Sales are up 80% this year, while the market is even tighter with inventory down 33%. Now this is possible due to the law of small numbers which says when you don’t have much of something even a small change makes a big percentage change. The 80% increase in sales is from 5 sales last year to 9 sales this year, while inventory shrank from 15 listings to 10 listings. Two the three price change indicators are up in Byram. The sales price to original list price ratio went from 88% last year to 90% this year and the sales price to assessment ratio is the second highest in town at 1.807 or 27% higher than the Assessors assigned values as of 10/1/2015.
Summary
Like May, July was close to our 10-year average and therefore looked good compared to our weak sales in other prior months. Were it not for a slow June, we could call continued good sales in July a turn around. Also, the neighborhoods are spotty with no area reporting stronger sales, lower inventory and the price change indicators all up. We did have an above average number of contracts at the beginning of August and based on the first two weeks August is looking to be another “average” month, which is good in 2019.