By Mark Pruner
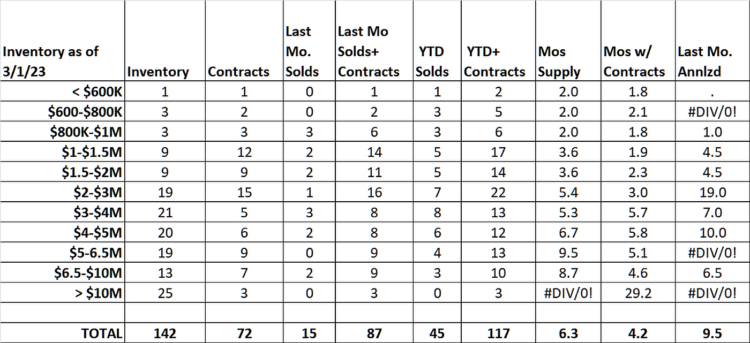
The spring market is underway with contracts up 46% from last month. We went from 50 contracts at the end of January to 72 contracts at the end of February. Pretty much every new listing that came on market had an offsetting listing going to contract. The result is that our inventory has been essentially flat all year. We have gone from 132 single family homes on the market as of the second week January to 138 homes on the market as of last week. This week we finally got above 140 listing to 142 up four net listings.
86 new listings only net 10 active listings
I say net listings, because while inventory has been flat, we’ve had 86 new listing. So how could we have 80 new listings, and inventory has gone up by only 10 listings? To see what happened let’s take an in depth look of at those 86 new listings that came on this year. Of those 86 listings 7 of them are already sold. Another 24 new listings are already under contract. Of those 24 contracts, 15 are pending, i.e., non-contingent and ready to close. The other 9 contracts are contingent, which usually means that they are waiting for mortgage approval. This leaves 49 of the 86 listings that came on this year that still active. We also had one listing come on and get cancelled after one day on the market.
More inventory coming soon
After all that, we have 6 listings that aren’t covered by the above and that is because they are in “Coming Soon” status. This newly created category allows agents to list properties and market them, they just can’t show them or present any offers received to the owner. So why would an owner want to list their property when it can’t be shown and where offers have to be withheld from them. It turns out that this status is actually very helpful for both buyers and sellers.
By letting buyers and their agents know about the coming active status, showings can be scheduled back-to-back after the realtor open house. Russ and I used this status to get 21 showing in 5 days on a $10 million plus house. Everyone got a chance to see the house and we got to contract in 10 days.
Coming soon built anticipation, in a price range that has had no closed sales yet this year and 2 years of supply, when you add in 3 contracts that we do have. On another house, we had 62 people come see the house in 4 days and got to contract in 8 days. Coming Soon works when used for the right properties.
February 2023, a bad month for sales
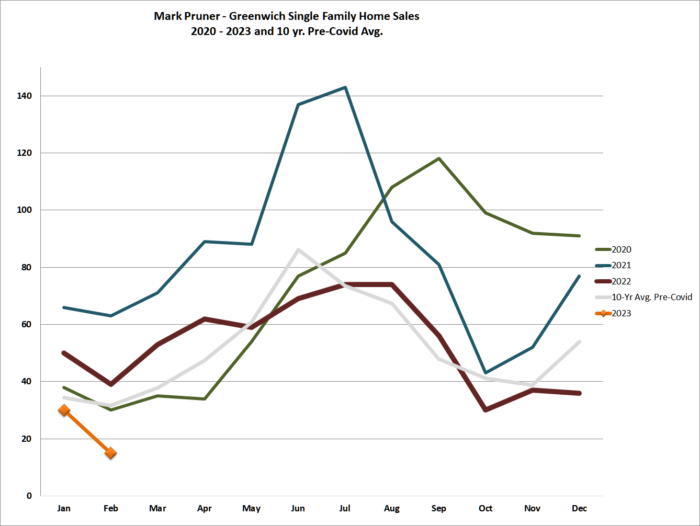
Make no mistake in this market, using every marketing technique is essential. Which brings us to the bad news for February 2023. Last month, we only sold 15 houses, the second lowest number of sales in any February in last 24 years. The only February that was worse was the ten sales that we had at the bottom of the Great Recession in February 2009.
To see just how bad this February’s sales were our 10-year, pre-Covid average for February is 32 sales, so we are down more than 50% from the ten-year average. This steep drop in sales will make for dramatic headlines, but don’t forget those 72 contracts that we have waiting to close. Unlike February, March 2023 sales won’t look like the Great Depression.
These 72 contracts also show where the market is today. New or like new house are hot. Of our 72 houses under contract, 52 or 72% were built or renovated in this century. The other thing you can see when you at our contracts is that high-end houses, those over $4 million, are seeing better sales than houses under that number.
Higher interest rates mean that many people have been priced out of the market. You can see that by big drop in contingent contracts as a percentage of all contracts. Cash is always king, but now it’s been promoted to emperor. We have twice as many pending contracts as we have contingent contracts, when in normal times we have more contingent contracts than non-contingent.
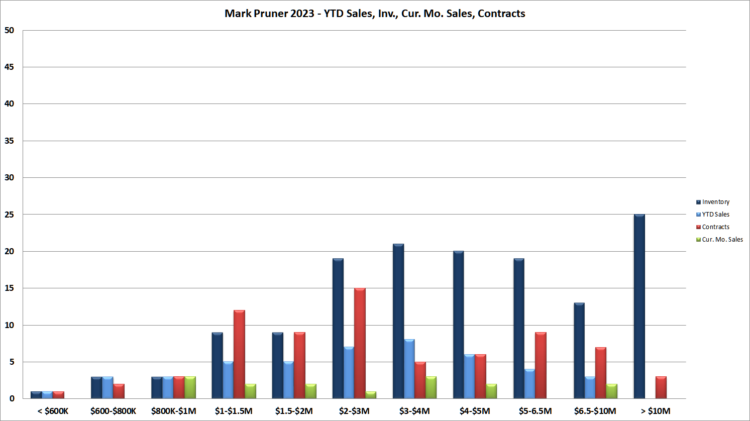
The other reason for lower sales under $3 million is that we just don’t have enough inventory for the demand that we have. All the way up to $3 million we have a super-seller’s market with our months of supply under 3 months of supply, but only when you throw in those 72 contracts. If you look just at closed sales, the months of supply is higher from $1 million to $10 million. The other thing that including those 72 contracts shows is that what had been buyers’ market in January for our $5 – 10 million dollar range has seen a dramatic turn around with buyers signing contracts in this price range.
Over $10 million we have no sales yet, but we do have 3 contracts. Given the activity we saw for our over $10 million listing, why is this market so slow? A significant part of the story is that we have a mismatch, between what buyers are looking for and what is available. Just as with the rest of the market newer houses sales in today’s styles sell (of course good marketing doesn’t hurt :).
The other thing we are seeing with the new contracts is a trend to the eastern side of town with good contracts in Riverside, Cos Cob, and the eastern side of mid-country. (You’ll note that Old Greenwich is not part of this trend, but that is primarily due to an inventory shortage. In OG, where we only have 10 listings and of those 10, only 3 are under $3 million. We’ll have to see if these preferences really are trend, as the year goes on, but it’s a good time to have newer house on the eastern side of town listed for under $3 million.
The base effect
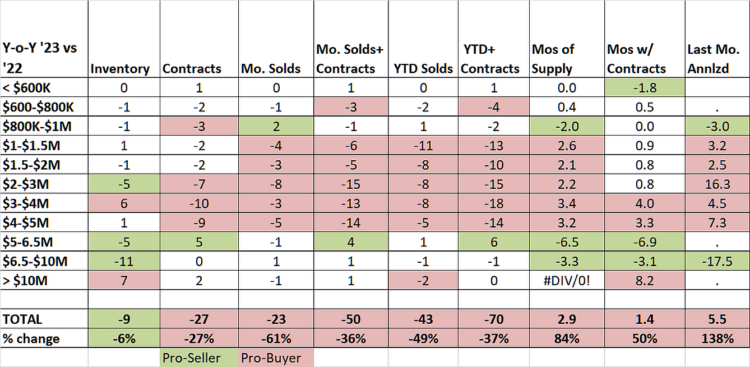
You are going to see a lot of stories about how much sales and contracts are down from last year. One of the main reason that 2023 compares so poorly to last year is that the first quarter of last year included “The Frenzy”. In The Frenzy everything was selling including older houses that needed work, house on the a highway, and houses on poor lots. As a result, 2023’s will come off poorly compared to the first quarter of 2022.
Compared to 2022, our inventory is down a little bit, which is remarkable when last year’s inventory was already at all-time record low levels. So far this year, we have broken those 2022 record low inventory numbers every week. The other thing that you see compared to 2022 is that our contracts and sales are down from $1 to 5 million. Interestingly, when you look at months of supply with contracts, you see little change from $600,000 to $3,000,000. A combination of lower inventory and improving contracts mean this market is as tight as in The Frenzy.
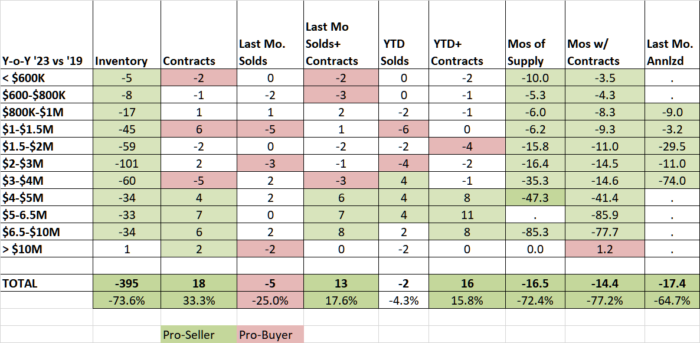
How does February 2023 compare to our last pre-Covid February, 2019; well, it doesn’t look too bad. Compared February 2019, our 2023 inventory, isn’t lower, it’s fallen off a cliff. Inventory is down 395 listings or 73.6%. Contracts are actually up by 18 deals or 33% in 2023, while sales are about the same. t. Months of supply in 2023 are also way down due to the much lower inventory and comparable sales.
Some of the numbers in a 2023 to a 2019 comparison are remarkable. For example, our months of supply for the $4 – 5 million price range is down by 4 years! The result is that you can tell two very different stories, just by picking the base year that best tells the story you want.
February was a bad sales month, but March will be better. Many houses are moving to contract quickly, but it is very much a bifurcated market. If your house isn’t newish, you need to competitively price it. The next couple of months may very well set the tone for the whole year.
Mark Pruner is a Realtor with Compass. He can be reached at 203-817-2871 or mark.pruner@compass.com