By Mark Pruner
Greenwich real estate is doing much better than much of the U.S. real estate market. In fact, by most measures our market has gotten tighter in the last few months. To be fair the rate of increase has slowed, but prices are still going up and months of supply remains very low.
Greenwich Prices are up both Y-o-Y and since April when the Fed started raise rates
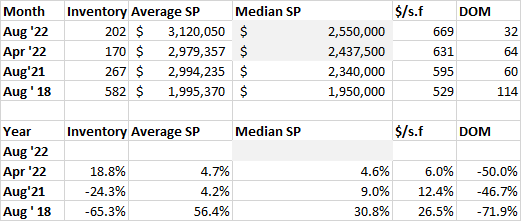
Our average sales price for a single-family home in Greenwich year-to-date is $3,120,000. Sales prices are up 4.7% from April 2022, when the Fed started their big rate hikes. It’s not just the average price that is up, our median price is up 4.6% to $2,550,000. Think about that, half of the Greenwich homes sold in 2022 have sold for more than $2.5 million. Back in August 2018, the median price was $1.95 million, so we have seen an increase of 30.8%, since 2018, our last good pre-Covid year.
When talking about prices, particularly in Greenwich, you have to take the average sales price changes with a grain of salt as much of the change is due not to overall price rises, but to the change in the mix of what is selling. Our high-end can be very high and it doesn’t take many big sales to move the average sales price. Last year we sold 3 houses over $27 million, so far this year, we’ve sold none. Our highest reported sales price is $17.6 million. (Congratulations to Brian Milton and Yashmin Lloyds).
To further see how the mix of high-end sales, and a decrease in sales under $1.5 million affected prices compare the median sales price to the sales price per s.f. Since April, our median price is up 4.6%, while our sales price per square foot is up 6.0%. The price per s.f. is less affected by the mix of what is selling, so it can be a better indicator. The bottom line is that all three price averages are up on a year-over-year basis. These indices are up for the last four months even as the Fed has jacked up the fed funds rate by 225 basis points this year.
Months of Supply stays tight and days on market continue to slide
Another indicator of a tightening market is a decrease in days on market of properties that are selling. Our days on market have gone from 114 days in August 2018 to around 60 days in August last year and April this year. Since then, the market has got even tighter to only 32 days on market for sales in August 2022. At the same time our months of supply has stayed in the super-seller’s market of 3.4 months of supply up slightly from 2.8 months of supply in August 2021.
It may seem that the slowdown in the economy and the increase in interest rates has not affected Greenwich, but what we are really seeing are two countervailing trends. Sales have slowed from last year going from 751 sales last year by the end of August to only 477 sales at the end of August 2022. Had inventory stayed the same, our months of supply would have jumped this year, but right now our inventory is down 24% from last August. What’s really amazing about this, is that last August’s 267 listings were a record low for August. One most people didn’t expect to go a lot lower.
Even more amazingly, inventory did continue to drop for the next 6 months, all the way through March, when it hit an all-time low of 140 listing. From there we had a “strong” recovery to 222 listings by the middle of July. Since then, we seen inventory drift down to today’s 202 listings. All these numbers are still way below the 500 – 600 listings we’d expect this time of year. Combine decreasing sales and decreasing inventory and we’ve had a dynamic balance that has kept our market in the super-seller range, even as overall sales drop.
Sales climb back above average
So far in August we have had 72 sales compared to our 10-year, pre-Covid average of 67 sales. As usual, our August sales are down from July sales, but by next week, August sales are likely to be above July’s sales of 74 houses as late sales are reported. We always have a few late sales reported, but the Greenwich MLS has really tightened up on the reporting rules, so a couple of days more and we should have them all.
Sales below $1.5 million “fall”
As you might expect with rising interest rates sales at the lower end, which are more sensitive to mortgage cost increases have declined. A couple of clarifications though; first in Greenwich, we really don’t have a low-end. Every house in Greenwich has sold above the national average of $430,000. Secondly, sales are down in every price, except for $4 – 5 million where they are up only 8%. When you compare this August’s sales to August 2018, our last good pre-Covid year, sales above $1.5 million are up 52 houses this year, while sales below $1.5 million are down 47 sales.
What is even more revealing is that that this August we only have 15 contingent contracts out of 87 total contracts or 17%. In August 2018, 31% of 61 contracts were contingent, or almost double the percent contingent contracts in 2018. People without cash are being squeezed by both higher rates and also the tight market. If you are looking to buy under $1.5 million in Greenwich, it really helps to bring cash or an underwritten pre-approval to the bidding process.
The market is slowing, but above $1.5 million, it’s actually doing fairly well, given how little inventory we have. The one exception is the over $10 million market which remains slow. Sales at the high-end have moved later in the year. In August our market from $5 – 6.5 million did particularly well with 22 sales and contracts compared to only 26 sales before this month.
If you want to be the prevailing buyer in this market, get a good Realtor, attorney and inspector. It’s still tough out there. At the same time if you are a seller, it’s a declining market and not the time to try an aspirational price.
Stay tuned …
Mark Pruner is a Realtor with Compass. He can be reached at 203-817-2871 or mark.pruner@compass.com

