By Mark Pruner
Stranger in a Strange Land
Inventory is up 58%, sales are half of what we had last year and still we have a market that favors sellers. This year, 2022, has been a strange year.
Some recent history can be very helpful to see how we got to our very contradictory real estate market. Last year inventory was about half of our average inventory. We peaked at 342 listing in the first week of June 2021 and then took a long, slow slide for the rest of the year. By the end of the year, we had dropped to only 152 single family homes on the market. This compares to our previous low of 299 listing over two decades ago and to an average yearend low of 390 listings. As a result, we started 2022 with inventory numbers that we didn’t have even a close precedent. We then proceeded to drift down week by week finally hitting a low point of 140 listings in March 2022.
With very little to sell, you’d think that contracts would fall too. You would have been right from June to September of 2021and then the strange things started to happen. Contracts stopped falling in October and remained flat until the year-end holidays, even as inventory took a steep dive. We had a lot of smart foresighted buyers. They correctly predicted that interest rates were going to rise, and inflation was going up too and house prices would continue to rise. Lots of buyers made the decision to buy one of the few houses that we had. They figured the house might not be perfect, but they could change that, what they couldn’t change was higher prices, higher interest rates and higher inflation so the fourth quarter of 2021 and 2022 were good times to buy.
As the Fed got serious about raising interest rates, contracts flattened out from April to June. Flat contracts numbers might seem like a flat market, but it actually represented a tight highly competitive market. Since total contracts is the difference between houses closing and going out of contract and listing going into contract, to have contract flat, meant that houses were closing just as fast as they were coming on the marketing. We saw this by the continuing decline in the days on market, a major sign of a hot market.
Our best indicator of how tight the market is, months of supply dropped from even the low levels of 2021. It was a small drop, but it led to March and April 2022, being the tightest markets, we have ever seen with months of supply measured in a couple of months and in some price categories measured in weeks.
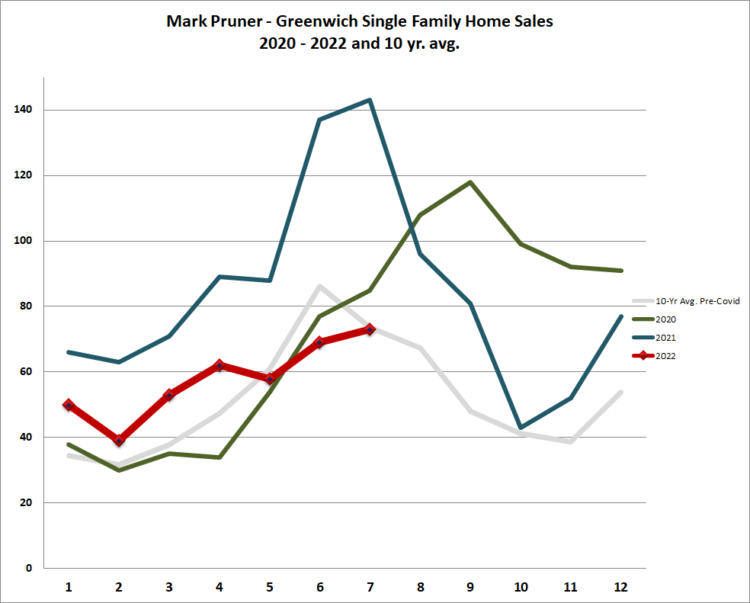
Then came July 2022 and market dynamics changed quickly. Our inventory climbed 58%, sales were cut in half, and contracts dropped throughout the month, which should be an unmitigated disaster, but it isn’t, because 2022 is a strange year. This year we have massive tectonic plates (market factors) butting up against each other and it not at all clear which plate is going to be the subducted plate and which plate is going to be uplifted. We are coming off a trillion dollar plus stimuli from the federal government. This stimulus has a long lag and is a major cause of the inflation that we are seeing now. At the same time, any government spending this year is going to be a lot less than last year. So, sales should fall, and they have. Our sales are down dramatically from 143 sales in July 2021 to only 73 sales in July 2022. Having said that our 73 sales are identical to our 10-year pre-Covid average. This must mean that we are back to normal.
However, in this strange land, anything that looks like normal is purely a statistical coincidence. Our sales are the same as our 10-year pre-Covid average, but our months of supply are down to 3.8 months of supply from 16.4 months of supply in 2019. To see how much things have changed from anything that could be considered normal compare months of supply in 2019 and this year. In 2019 we had 39 months of supply from $5 – 6.5 million, as of the end of this July you are looking at 7.3 months of suppl or a drop of 2.6 years of supply. At the other end of the price range, from $800K – 1.0 million we are down from 8.7 months of supply in 2019 to only 2.1 months of supply this year. In 2019 a buyer had a choice of 32 houses listed from $800K – 1.0 million. In July 2022, a buyer only has a choice of 8 houses in that price range. That 2019 buyer had several choices in Riverside and Old Greenwich. Our 2022 buyer has a choice of one house in each of Riverside and Old Greenwich and the remaining 6 houses are clustered in southeast Greenwich along the NY border.
Another statistic that may look normal but is actually very strange: take a look at our months of supply. MoS is fairly flat in most price ranges up to $5 million, what could be more normal than consistency. However, MoS normally increases from the low end to the high-end. Also, months of supply are fairly consistent whether you calculate months of supply with just sales to date, or if you include contracts, or if you just analyze the July sales you get about the same months of supply. What this means is that we have a “stable” market without big drops as you look further into the future. In this case “stability” is more a sign of broad uncertainty. It’s a strange stability, and months of supply is up a little from June, so this stability may not last long.
The question is we going to get back to a balanced market with months of supply around 6 months of supply? To do that, we have to have a lot more inventory or sales have to drop significantly, which with a very aggressive Fed is possible. However, it’s not likely given our very low days on market. There are still a lot more buyers than we have inventory; it’s just that, like all of us, they are suffering through a large amount of uncertainty. Uncertainty causes pauses and slowdowns, but so far, the dramatically bad predictions have not played out. The market has slowed, but over the last couple of weeks interest rates are down as is our inventory, both signs of a tighter market.
As you would expect, with higher interest rates we are seeing a drop in sales in those price ranges where mortgages are most common. In the first half of the year, sales under $1.5 million represented about 25% of our market share. Last month sales under $1.5 million represented only 19% of our sales. With mortgage interest limited to the first $750,000, this is what you would expect, but remember this is a strange year. From $1.5 – 2.0 million market share went from 13.9% to 19.2%, so there is only so much you can read in to one month. Also, the number of deals with mortgage contingencies is way down, but it’s not clear how many people are foregoing mortgages or just foregoing mortgage contingencies.
What is clear is that we saw big changes in the market in July, and unlike June, these changes were reflected in the number of sales and contracts. You shouldn’t, and in this market, it would be ludicrous to, take a ruler and connect two data points and extend that line and expect that where that line is in 6 months has any predictive value. Now if we get 2 more months of data along that line, we might actually have a trend. Right now, we have very powerful forces pushing in opposite directions and it’s not clear where sales will come out.
Stay tuned …
Mark Pruner is sales executive with Compass in their Greenwich at 200 Greenwich Ave. He can be reached at 203-817-2871 or mark.pruner@compass.com.


